After you insert breakpoints to the application scripts in the
painter, you can click the Start
[appname] button ( ) in the PowerServer Debugger toolbar to run the
application in debug mode.
PowerServer Debugger may not return the value as expected in scenarios as below:
-
The CacheName parameters shown as used during debugging are the parameters from PowerScript, but the actual CacheName parameters used for the database connection are the ones configured in the PowerServer project.
-
Avoid debugging features unsupported by PowerServer. The debugging result does not reflect what the real application will look like. Also, the debugging may cause unpredictable crash. For a complete list of unsupported features, refer to Unsupported features & workarounds.
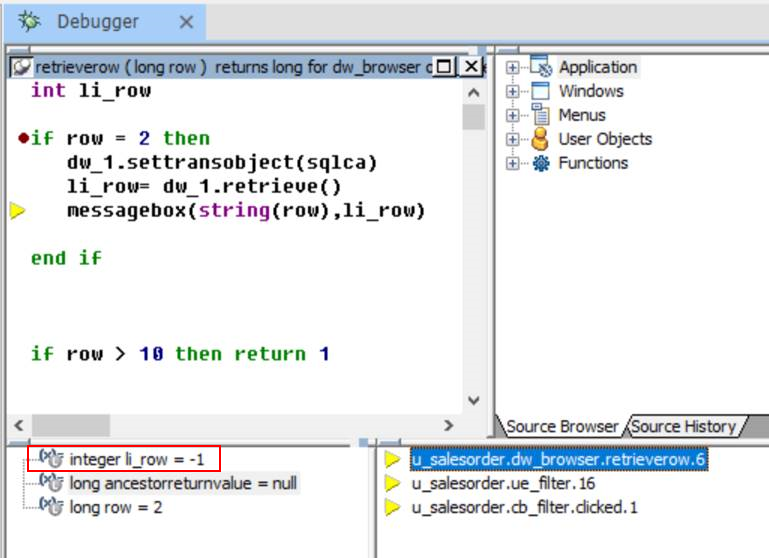
For example, PowerServer Debugger will return "integer li_row = -1" if the script contains unsupported feature:
-
It is not yet possible to directly view the return result of PowerServer Web APIs during the PowerServer debugging. If you want to debug PowerServer Web APIs, it is recommended to use the Web API Tester in SnapDevelop.
-
The parameters for external APIs require different types for 32-bit and 64-bit (for example, long for 32-bit and longlong for 64-bit). If the type does not fit, the call to the external API may fail, but no exception is thrown. So, you have to check by yourself whether the API is called successfully.


