First, you need to use Fiddler (or any other web debugging proxy tool) to get the HTTP requests. For how to use Fiddler, see Debugging with Fiddler.
Then you need to manually add the HTTP requests to JMeter.
Double check that PowerServer Web APIs is running before you proceed with the following sections.
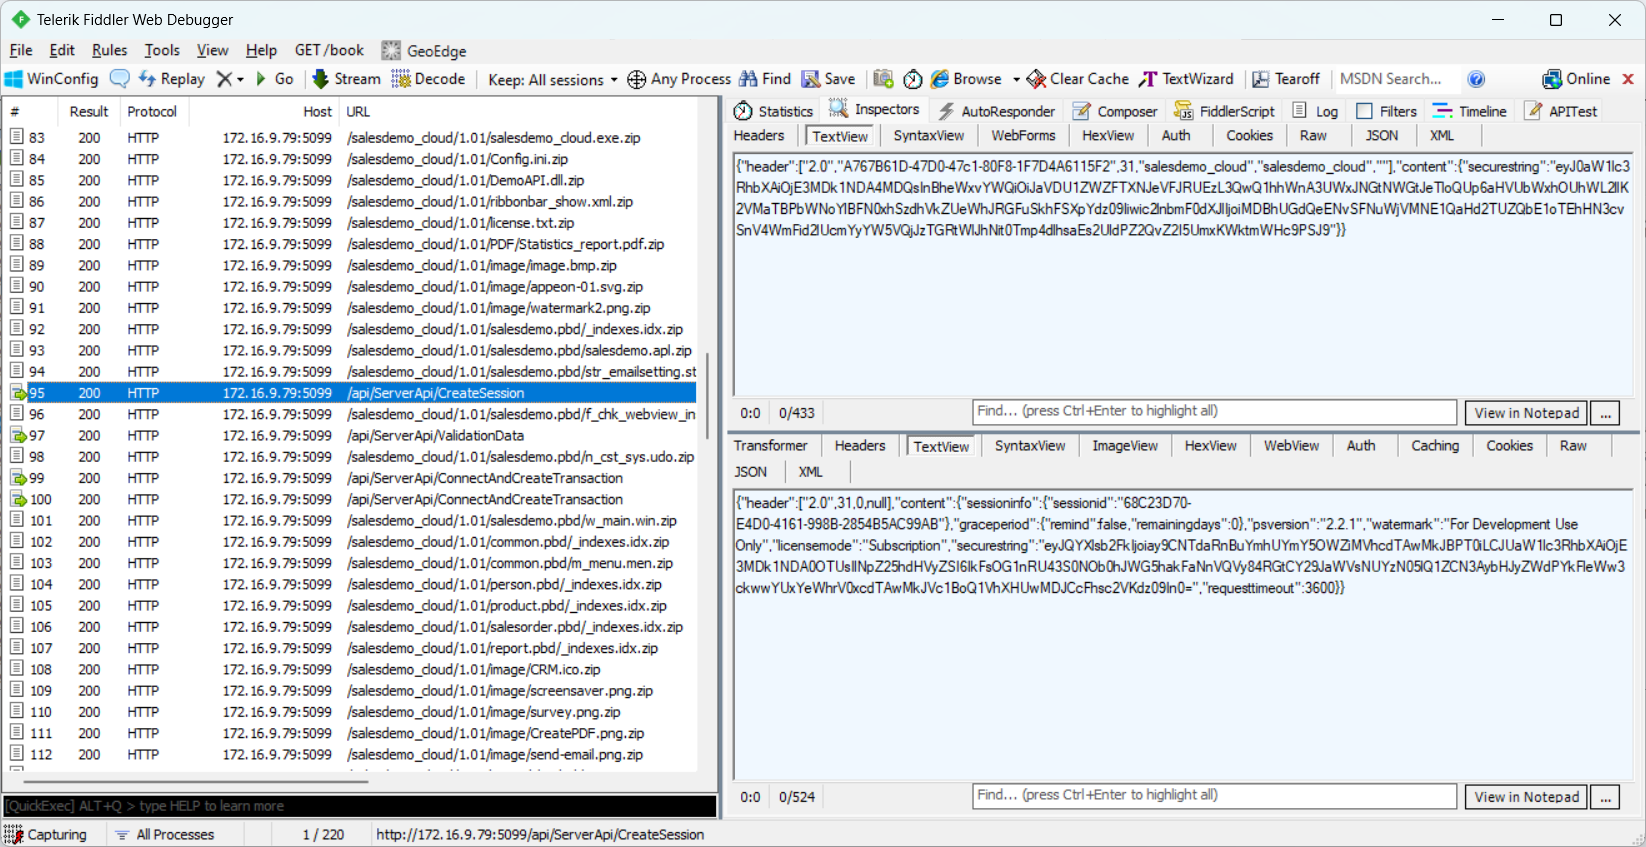
You can view the HTTP requests using Fiddler (or any other web debugging proxy tool).
Fiddler can capture every detail of the HTTP request and the header.
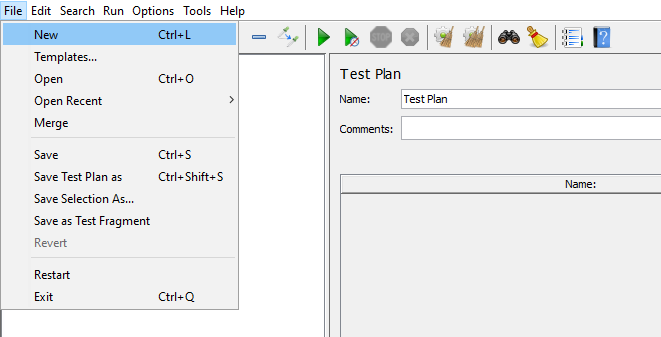
To create a new test plan, select File > New. Input a name for the test plan.
When the test plan is created, it is added to the tree on the left panel. All subsequent elements will be added to this tree in a hierarchical structure.
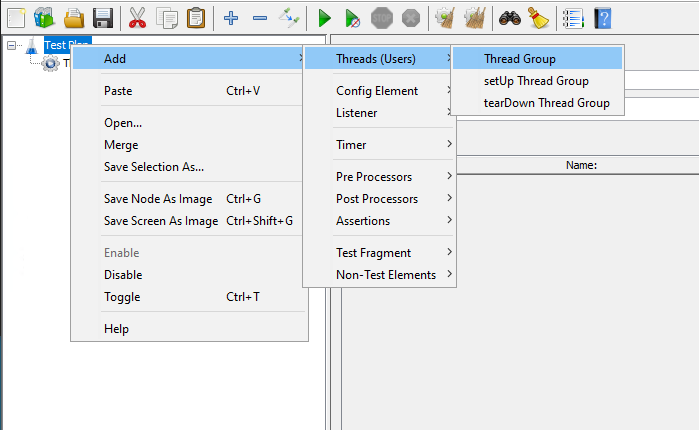
A Test Plan must have at least one thread group. The Thread Group tells JMeter the number of users (threads) you want to simulate, how often users should send requests and how many requests they should send.
To add a Thread Group to the test plan, right click on the test plan that you added just now, and then select Add > Threads (Users) > Thread Group.
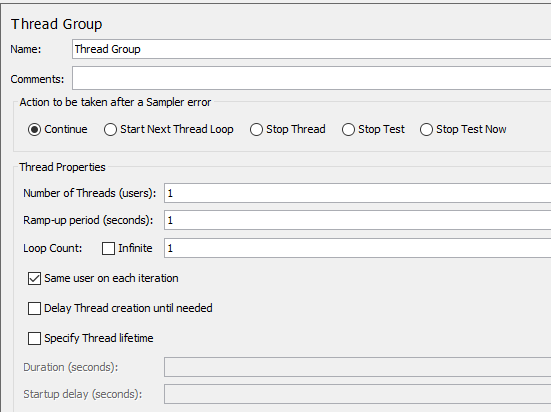
You will need to configure the following properties:
-
Number of threads (users): how many concurrent users will be accessing the PowerServer Web APIs.
-
Ramp-up period (seconds): how long to take to start all users. For example, if set to zero, all users will start immediately. If set the number of users to 100, and ramp-up periods to 50, that means in every second, 2 users will be started.
-
Loop count: how many times the test should repeat.
After you created the test plan and a thread group, you can determine which type of requests to make (such as Web (HTTP/HTTPS), FTP, JDBC, Java etc.)
In this test, you need to make the HTTP request to the PowerServer Web APIs.
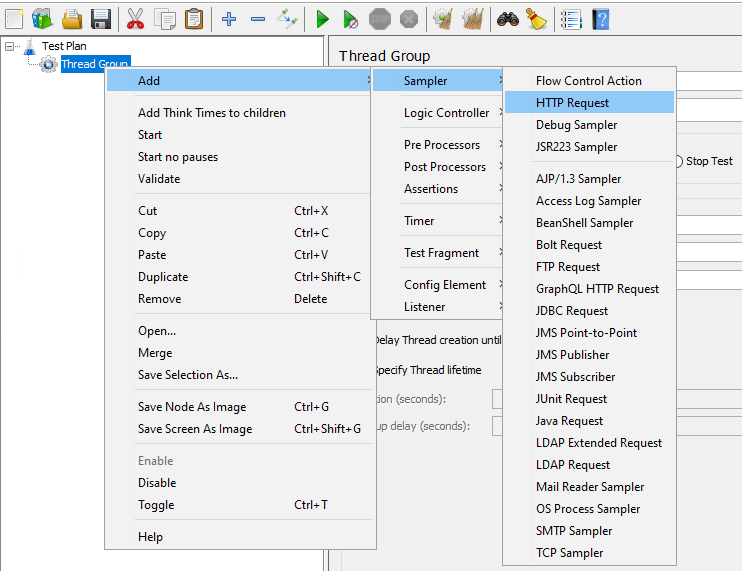
To add an HTTP request, right click on the thread group that you added just now, and then select Add > Sampler > HTTP Request.
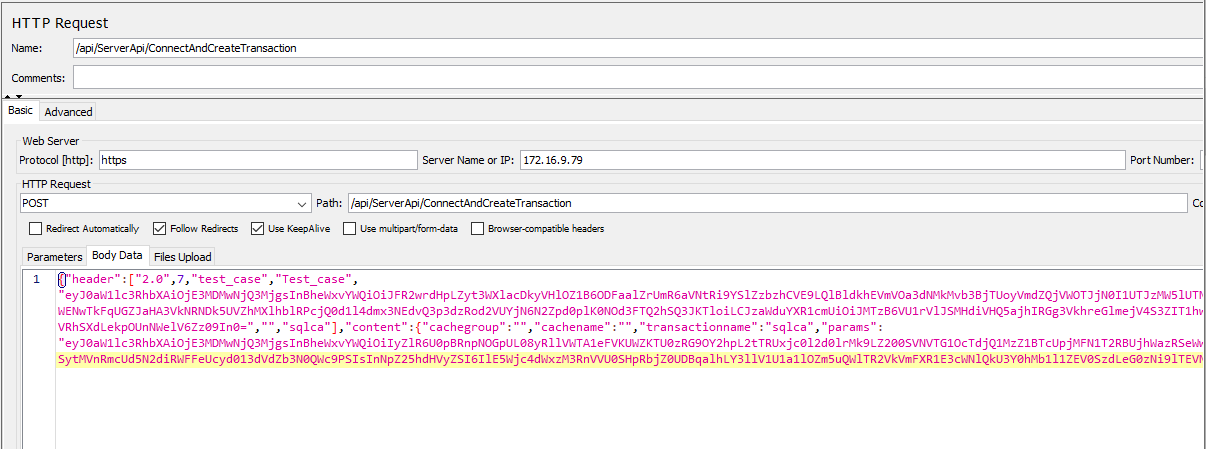
When you specify an HTTP Request, you can make use of the information obtained by Fiddler, such as the protocol, server IP, port, HTTP method, path, body data etc.
For example, you can add an HTTP POST request that accesses the ConnectAndCreateTransaction Web API, and input the JSON request body to the Body Data tab.
In the same way, you can add requests like GET, POST, PUT, and DELETE.
In case you have any specific headers that should be part of the HTTP request, you can add an HTTP header manager. The HTTP header manager lets you add or override HTTP request headers.
To add an HTTP header manager, right click on the HTTP request that you added just now, and then select Add > Config Element > HTTP Header Manager.

When you specify the HTTP header, you can make use of the information obtained by Fiddler.
For example, you can add the Content-Type and Accept-Encoding to the HTTP header manager.

If all requests will use the same header information, you can use one HTTP Header Manager for all requests (or even for all thread groups), instead of each request having its own HTTP Header Manager. You can adjust the hierarchical level of the HTTP Header Manager (by drag & drop) in Thread Group.
The above is basically everything you need as a minimum setup of an HTTP request suite.
However, in order for you to view the results and statistics of the test, you need to add Listeners. There are several types of listeners such as view results tree, summary report, graph results etc.
-
Summary Report: you can easily get the performance matrices of each request, such as the number of samples processed, the average response time, throughput, error rate etc.
-
View Results Tree: you can see all the details related to the request as well as HTTP headers, body size, response code etc. In case any request failed, you can get useful information from this listener for troubleshooting a specific error.
-
Graph Results: you can see a graphical representation of the throughput vs. the deviation of the tests.
-
There are a couple more listeners which you can take some time to explore.
You can add one or more listeners according to your needs.
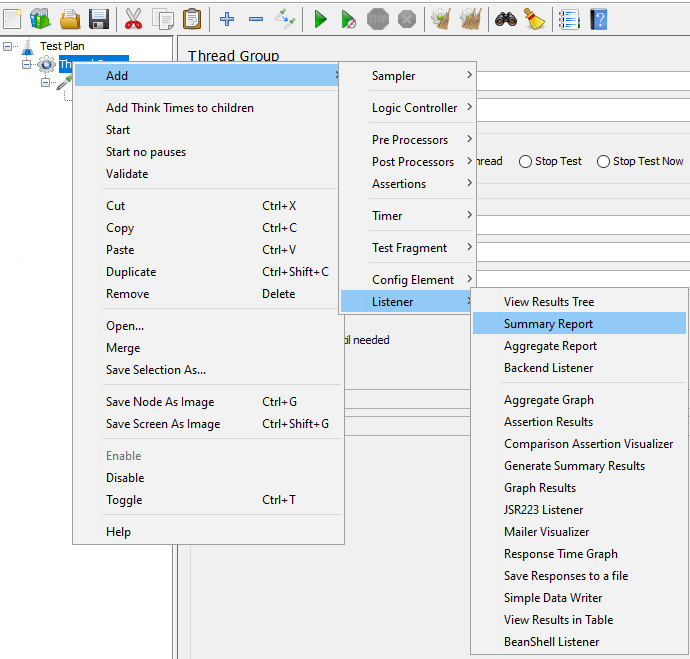
To add a listener, right click on the thread group, select Add > Listener, and then choose the listener.
To use the dynamic values of the access token, session ID, transaction ID etc. that are returned from the server, you need to correlate them in the scripts. See the section called “Parameterization and correlation” for detailed instructions.
It is recommended that you save the Test Plan to a file before running it.
To save the Test Plan, select Save or Save Test Plan As… from the File menu. The test scripts will be saved in a JMX file. You can then add this file to your project repository, and other members of your team can load it on their own JMeter tools as well.
Now you can start the test by clicking the Start button on the toolbar. This will start the thread group and the results will be captured by the listener.
To run the test again, clean up the previous result by clicking the Clear All button on the toolbar.
Use the various listeners to check the test results.
For example, the View Results Tree is the most commonly used listener which shows all the details related to the request, HTTP headers, body size, response code etc.
You can check if the session ID and the transaction ID are dynamic values in the request body, and use the code returned in the response data to check if the execution is successful or diagnose the error (if any).

The View Results in Table listener displays the information of the request in the form of a table, and in the order of time each request is made.
You can easily find out whether the requests are made simultaneously at the same point of time (for example, when Synchronizing Timer is added).

The Summary Report listener displays the performance matrices of each request, such as the number of samples processed, the average response time, throughput, error rate etc.


