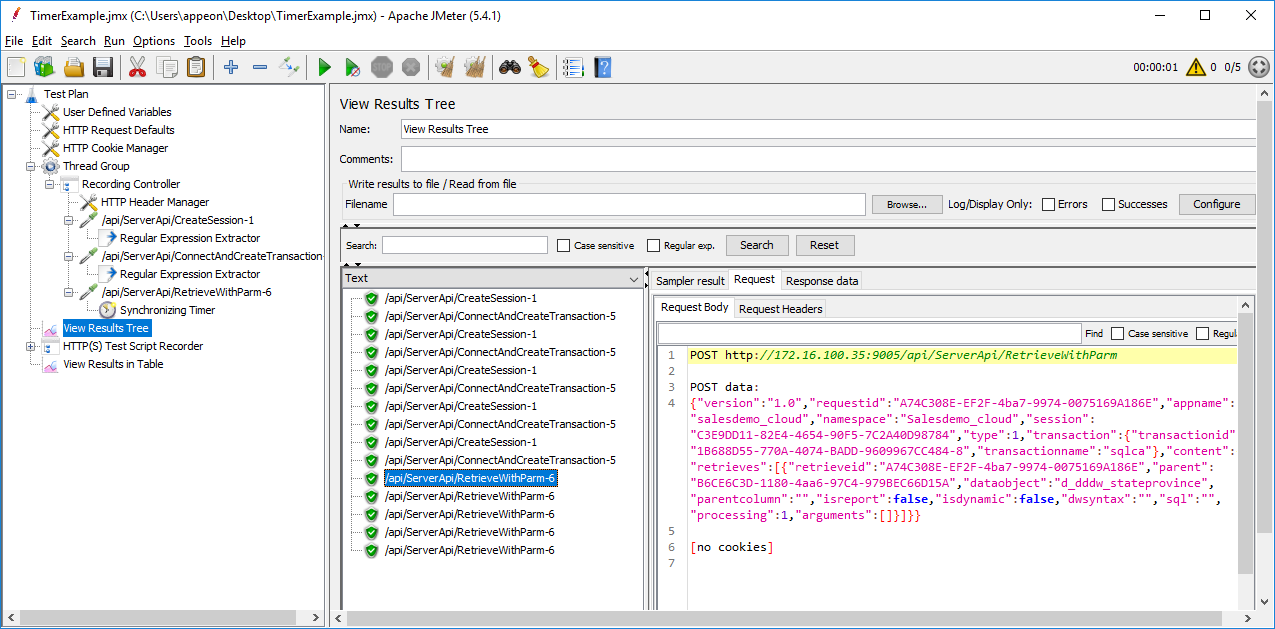
You will need to create a test plan to record the JMeter scripts. You can create a test plan either by
-
Using the JMeter HTTP(S) Test Script Recorder to automatically record the HTTP requests, or
-
Using Fiddler (or any other web debugging proxy tool) to get the HTTP requests and then manually adding the HTTP requests to JMeter
One easy way to create a test plan is to use the JMeter HTTP(S) Test Script Recorder. With Recorder, you can just browse on the application and do the actions and everything (including HTTP requests) will get recorded automatically.
This section provides step-by-step instructions for recording scripts on the Sales Demo application.
Double check that PowerServer Web APIs is running before you proceed with the following sections.
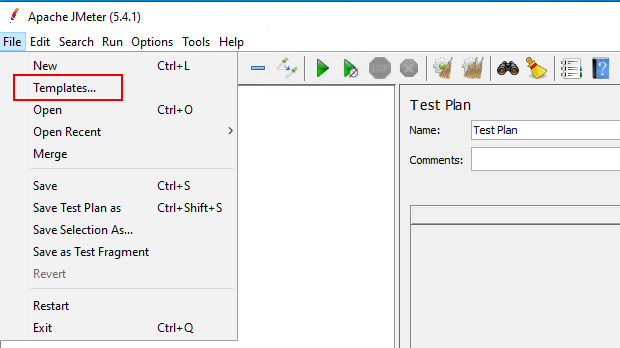
Step 1: Select Templates from the File menu.
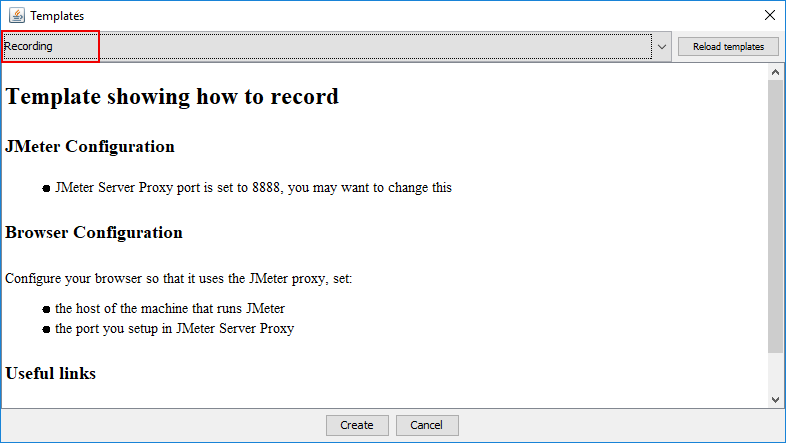
Step 2: Select Recording and then click Create.
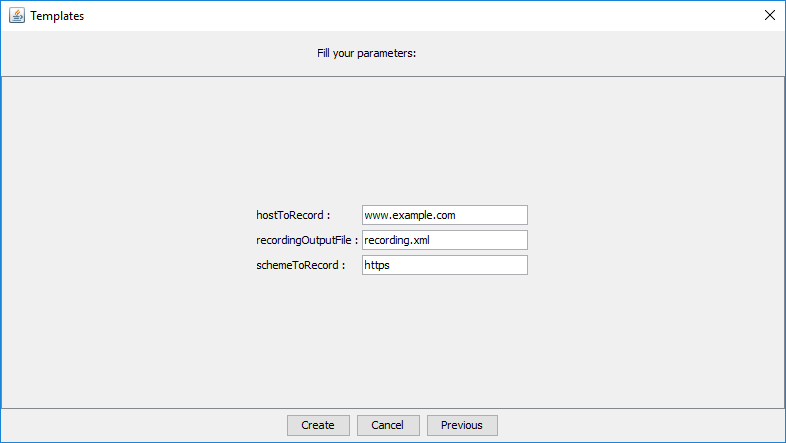
Step 3: Use the default values or modify them according to your needs, and then click Create.
A complete Test Plan is generated successfully.
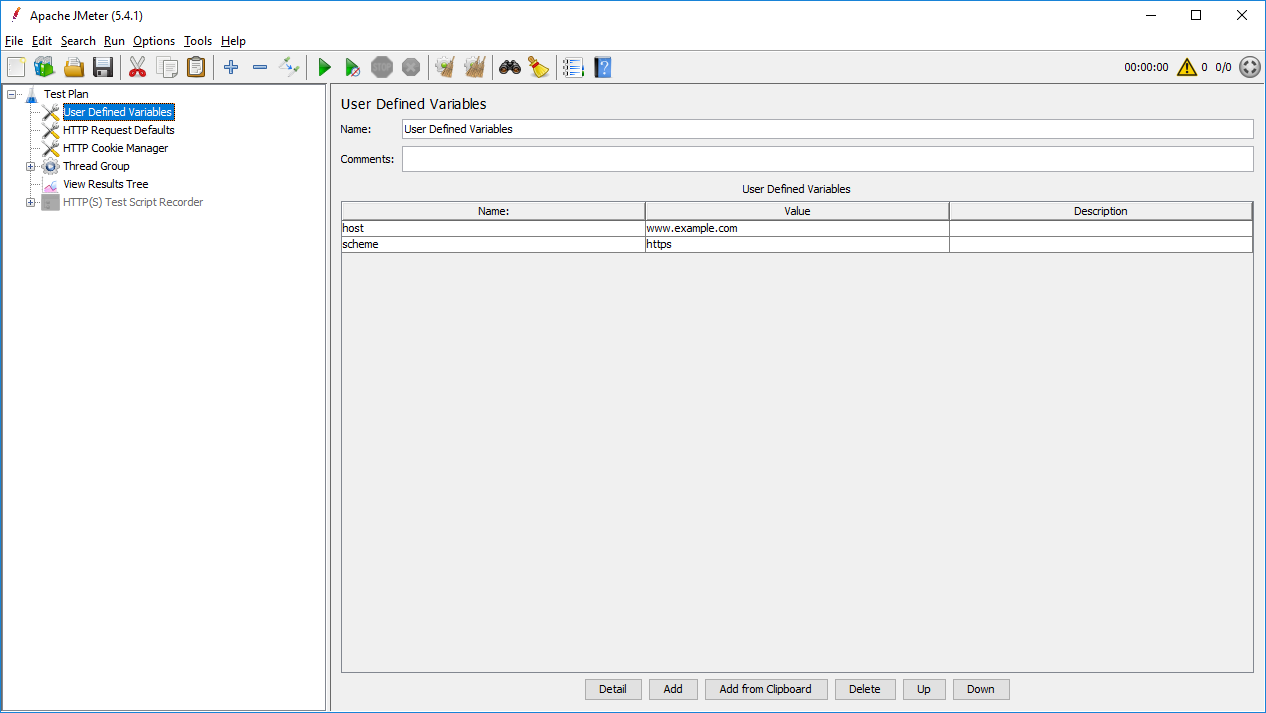
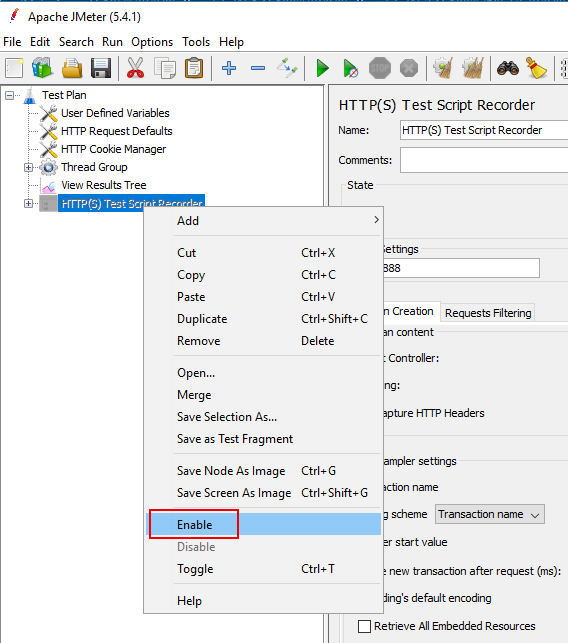
In Test Plan, the HTTP(S) Test Script Recorder is disabled by default.
Right click on it and then select Enable to enable it.
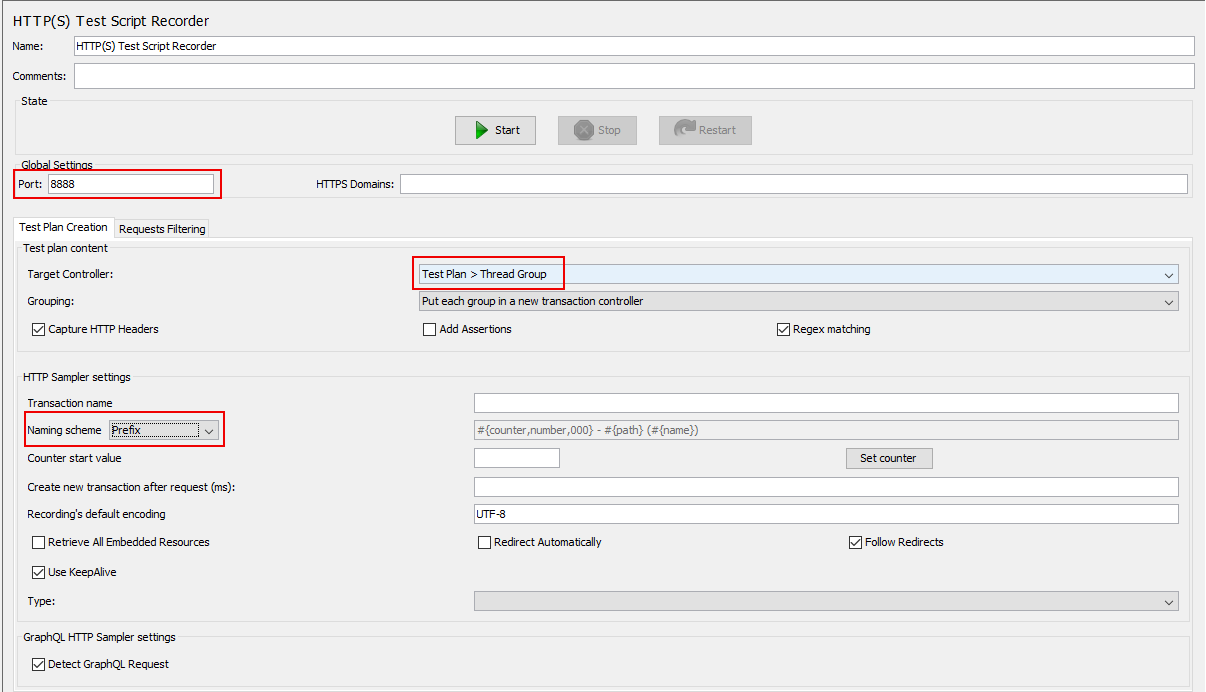
In the HTTP(S) Test Script Recorder window, specify the following settings:
-
Use the default port number 8888 or input a new one. Make sure the port is not occupied by any other program. Make sure the browser proxy is set to the same port later.
-
Modify Target Controller to Test Plan > Thread Group.
-
Modify Naming scheme to Prefix.
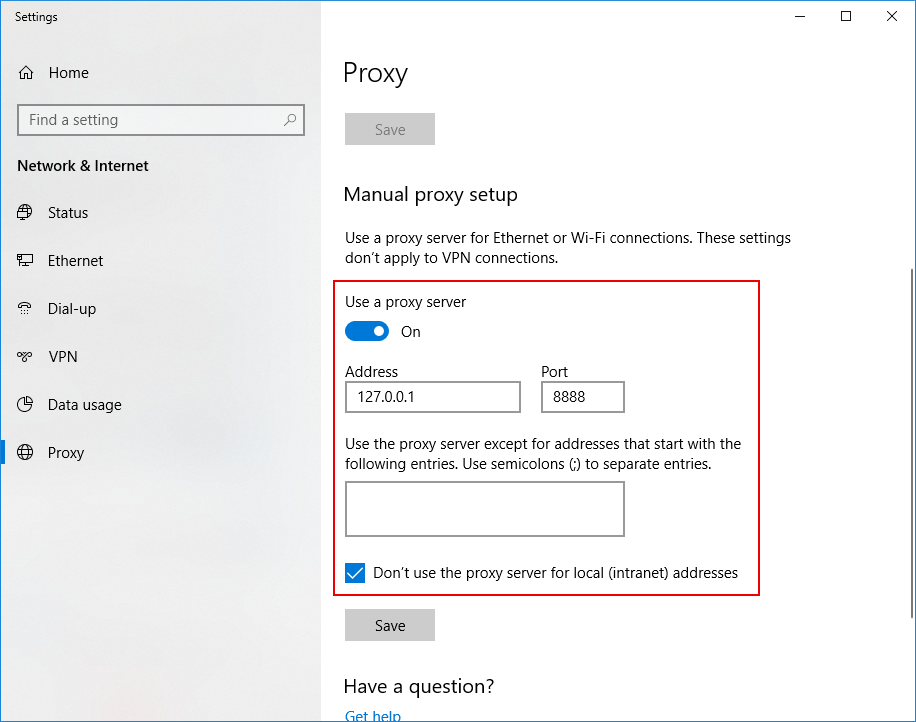
The PowerBuilder installable cloud app supports the Windows system proxy (not browser proxy), therefore you must configure your Windows system proxy to use the JMeter Proxy. You can either configure the proxy in the Windows system or in Internet Explorer (whose proxy settings will be synchronized with the Windows system). Notice that you should not configure the proxy in Firefox which provides the browser-level proxy.
Step 1: Open the Windows proxy settings (on Windows 10, click Settings > Network & Internet > Proxy, or simply input "proxy" in the Windows search box).
Step 2: Enter 127.0.0.1 and port 8888 (and make sure the Web API URL is not in the exception list).
Step 1: Return to HTTP(S) Test Script Recorder, and click Start.

This will start the JMeter proxy server which is used to intercept the browser requests.
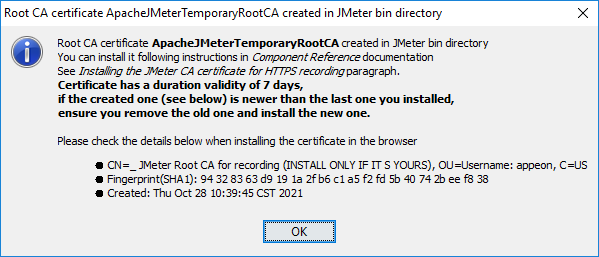
Step 2: Click OK when prompted to install the certificate as shown below.
Step 3: Keep the “Recorder: Transactions Control” window open during recording.

Step 4: Now run the Sales Demo installable cloud app in the Web browser. (Make sure PowerServer Web APIs started before JMeter started. See Running PowerServer Web APIs and then JMeter recorder and Fiddler for why.)
Step 5: Click a few buttons such as Address, Customer etc. in the window and then exit from the application. These HTTP requests will be automatically captured by the script recorder.
Step 6: Close the Web browser and return to the JMeter window.
Step 7: Click the Stop button in the “Recorder: Transactions Control” window to stop the recording.
After you finished recording the scripts, you can turn off the Windows system proxy or change it back to whatever it was before.
The recorded HTTP requests will be listed in the tree on the left panel. You can manually remove any HTTP requests that are not needed.
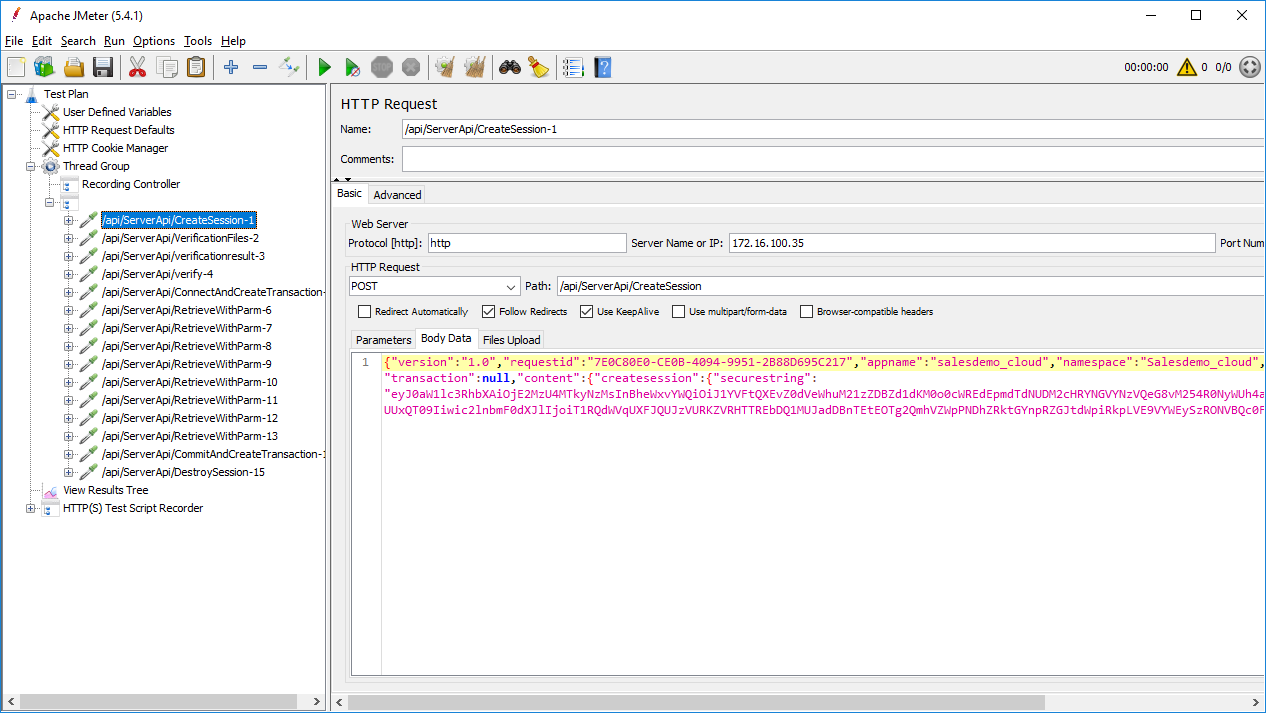
To use the dynamic values of the access token, session ID, transaction ID etc. that are returned from the server, you need to correlate them in the scripts. See the section called “Parameterization and correlation” for detailed instructions.
First, you need to use Fiddler (or any other web debugging proxy tool) to get the HTTP requests. For how to use Fiddler, see Debugging with Fiddler.
Then you need to manually add the HTTP requests to JMeter.
Double check that PowerServer Web APIs is running before you proceed with the following sections.
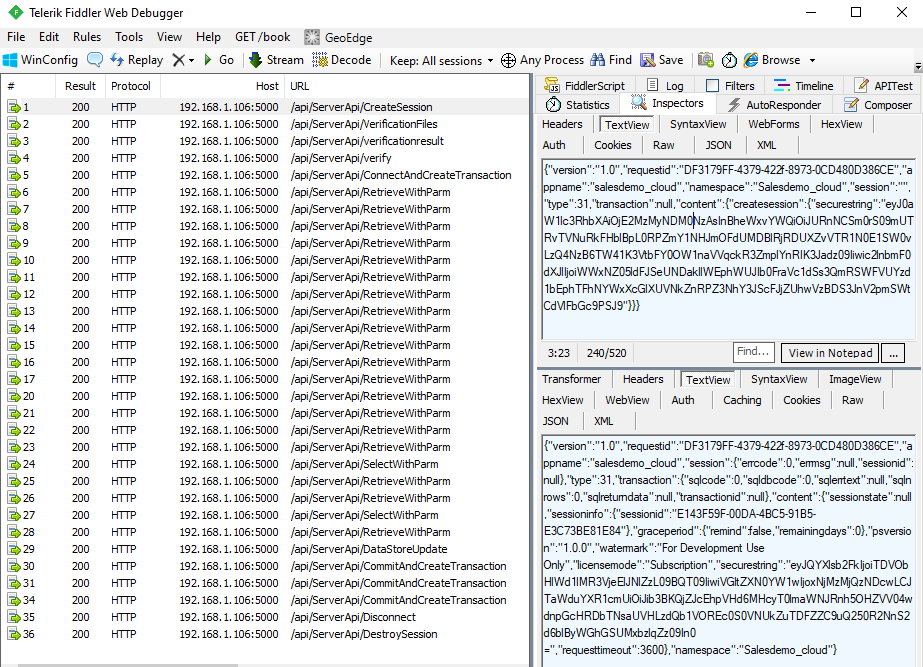
You can view the HTTP requests using Fiddler (or any other web debugging proxy tool).
Fiddler can capture every detail of the HTTP request and the header.
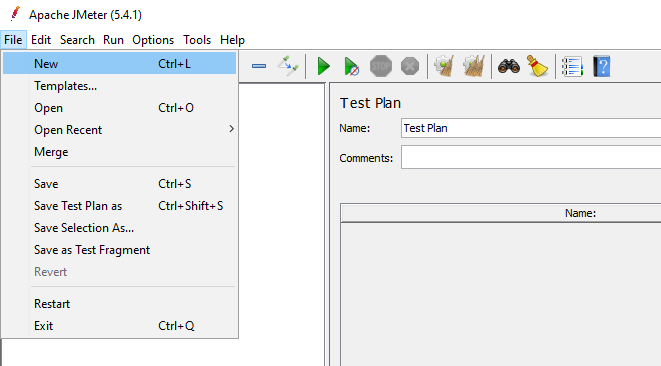
To create a new test plan, select File > New. Input a name for the test plan.
When the test plan is created, it is added to the tree on the left panel. All subsequent elements will be added to this tree in a hierarchical structure.
A Test Plan must have at least one thread group. The Thread Group tells JMeter the number of users (threads) you want to simulate, how often users should send requests and how many requests they should send.
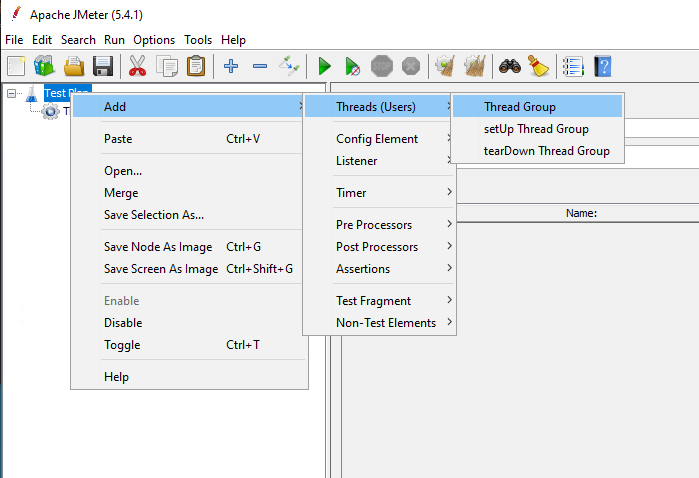
To add a Thread Group to the test plan, right click on the test plan that you added just now, and then select Add > Threads (Users) > Thread Group.
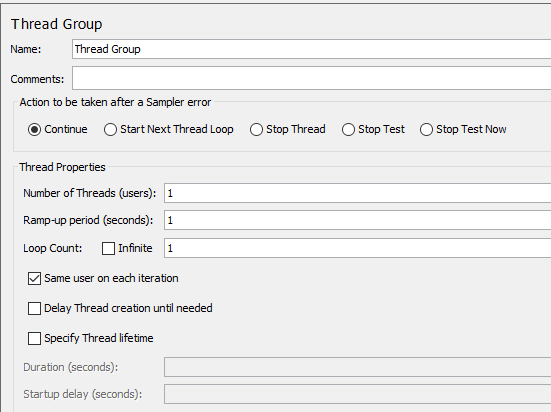
You will need to configure the following properties:
-
Number of threads (users): how many concurrent users will be accessing the PowerServer Web APIs.
-
Ramp-up period (seconds): how long to take to start all users. For example, if set to zero, all users will start immediately. If set the number of users to 100, and ramp-up periods to 50, that means in every second, 2 users will be started.
-
Loop count: how many times the test should repeat.
After you created the test plan and a thread group, you can determine which type of requests to make (such as Web (HTTP/HTTPS), FTP, JDBC, Java etc.)
In this test, you need to make the HTTP request to the PowerServer Web APIs.
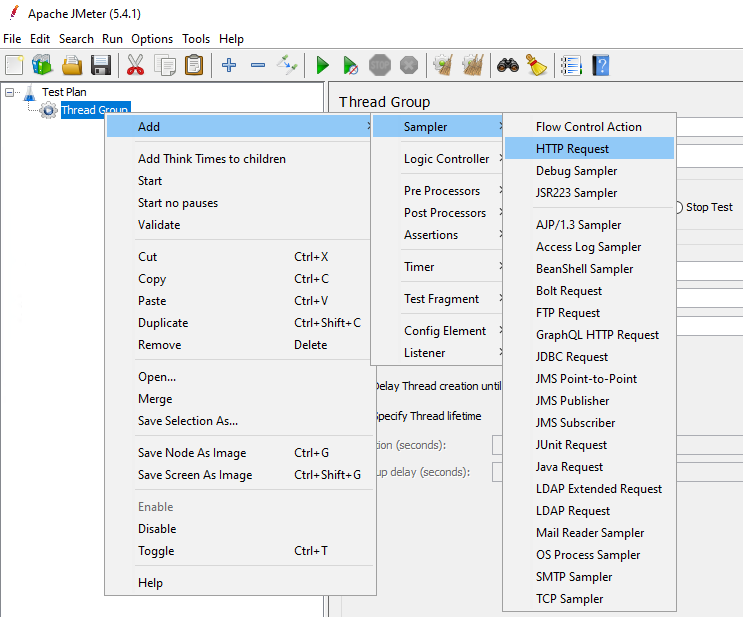
To add an HTTP request, right click on the thread group that you added just now, and then select Add > Sampler > HTTP Request.
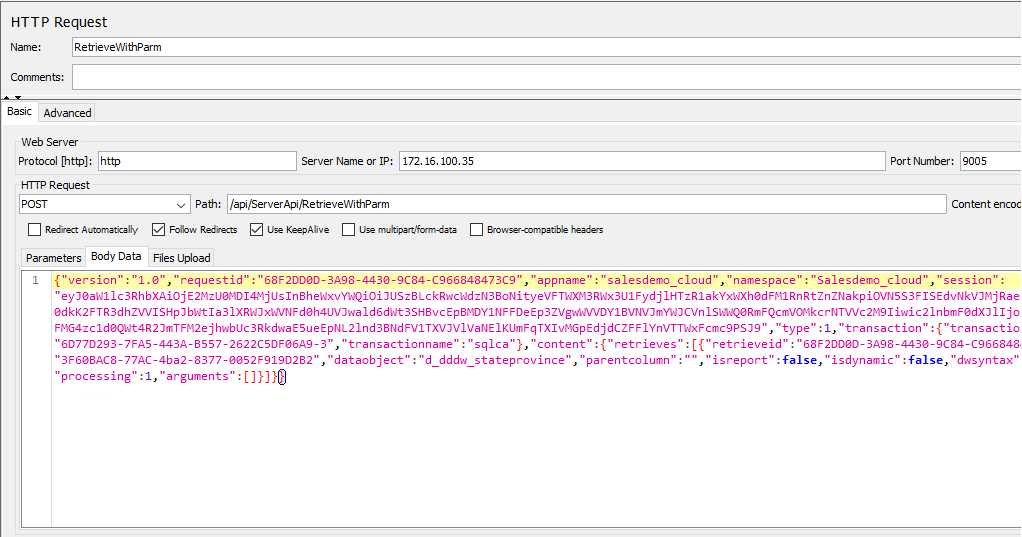
When you specify an HTTP Request, you can make use of the information obtained by Fiddler, such as the protocol, server IP, port, HTTP method, path, body data etc.
For example, you can add an HTTP POST request that access the RetrieveWithParm Web API, and input the JSON request body to the Body Data tab.
In the same way, you can add requests like GET, POST, PUT, and DELETE.
In case you have any specific headers that should be part of the HTTP request, you can add an HTTP header manager. The HTTP header manager lets you add or override HTTP request headers.
To add an HTTP header manager, right click on the HTTP request that you added just now, and then select Add > Config Element > HTTP Header Manager.
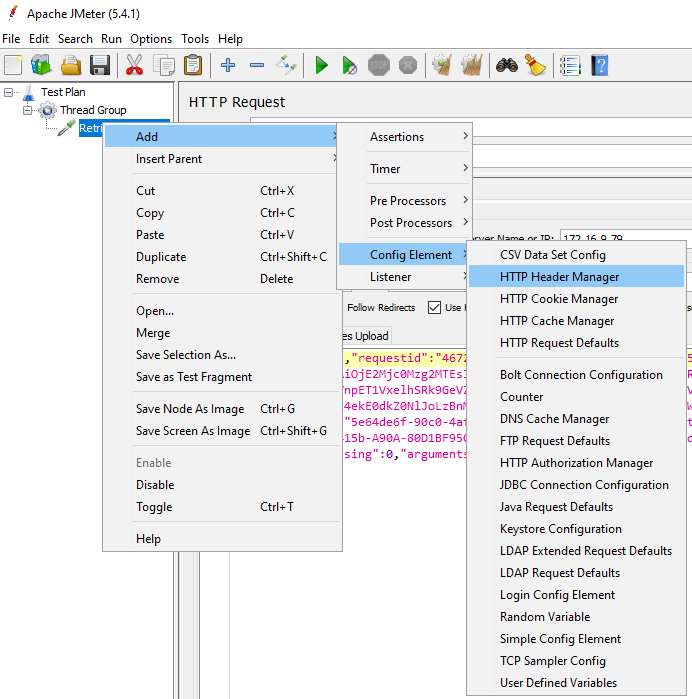
When you specify the HTTP header, you can make use of the information obtained by Fiddler.
For example, you can add the Content-Type and Accept-Encoding to the HTTP header manager.

If all requests will use the same header information, you can use one HTTP Header Manager for all requests (or even for all thread groups), instead of each request having its own HTTP Header Manager. You can adjust the hierarchical level of the HTTP Header Manager (by drag & drop) in Thread Group.
The above is basically everything you need as a minimum setup of an HTTP request suite.
However, in order for you to view the results and statistics of the test, you need to add Listeners. There are several types of listeners such as view results tree, summary report, graph results etc.
-
Summary Report: you can easily get the performance matrices of each request, such as the number of samples processed, the average response time, throughput, error rate etc.
-
View Results Tree: you can see all the details related to the request as well as HTTP headers, body size, response code etc. In case any request failed, you can get useful information from this listener for troubleshooting a specific error.
-
Graph Results: you can see a graphical representation of the throughput vs. the deviation of the tests.
-
There are a couple more listeners which you can take some time to explore.
You can add one or more listeners according to your needs.
To add a listener, right click on the thread group, select Add > Listener, and then choose the listener.
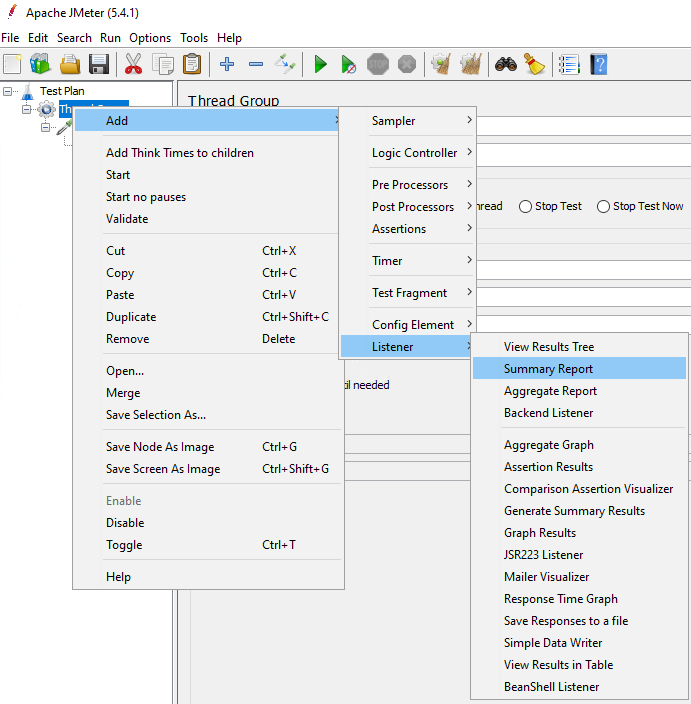
It is recommended that you save the Test Plan to a file before running it.
To save the Test Plan, select Save or Save Test Plan As… from the File menu. The test scripts will be saved in a JMX file. You can then add this file to your project repository, and other members of your team can load it on their own JMeter tools as well.
Now you can start the test by clicking the Start button on the toolbar. This will start the thread group and the results will be captured by the listener.
To run the test again, clean up the previous result by clicking the Clear All button on the toolbar.
Use the various listeners to check the test results.
For example, the View Result Tree is the most commonly used listener which shows all the details related to the request, HTTP headers, body size, response code etc.
You can check if the session ID and the transaction ID are dynamic values in the request body, and use the code returned in the response data to check if the execution is successful or diagnose the error (if any).

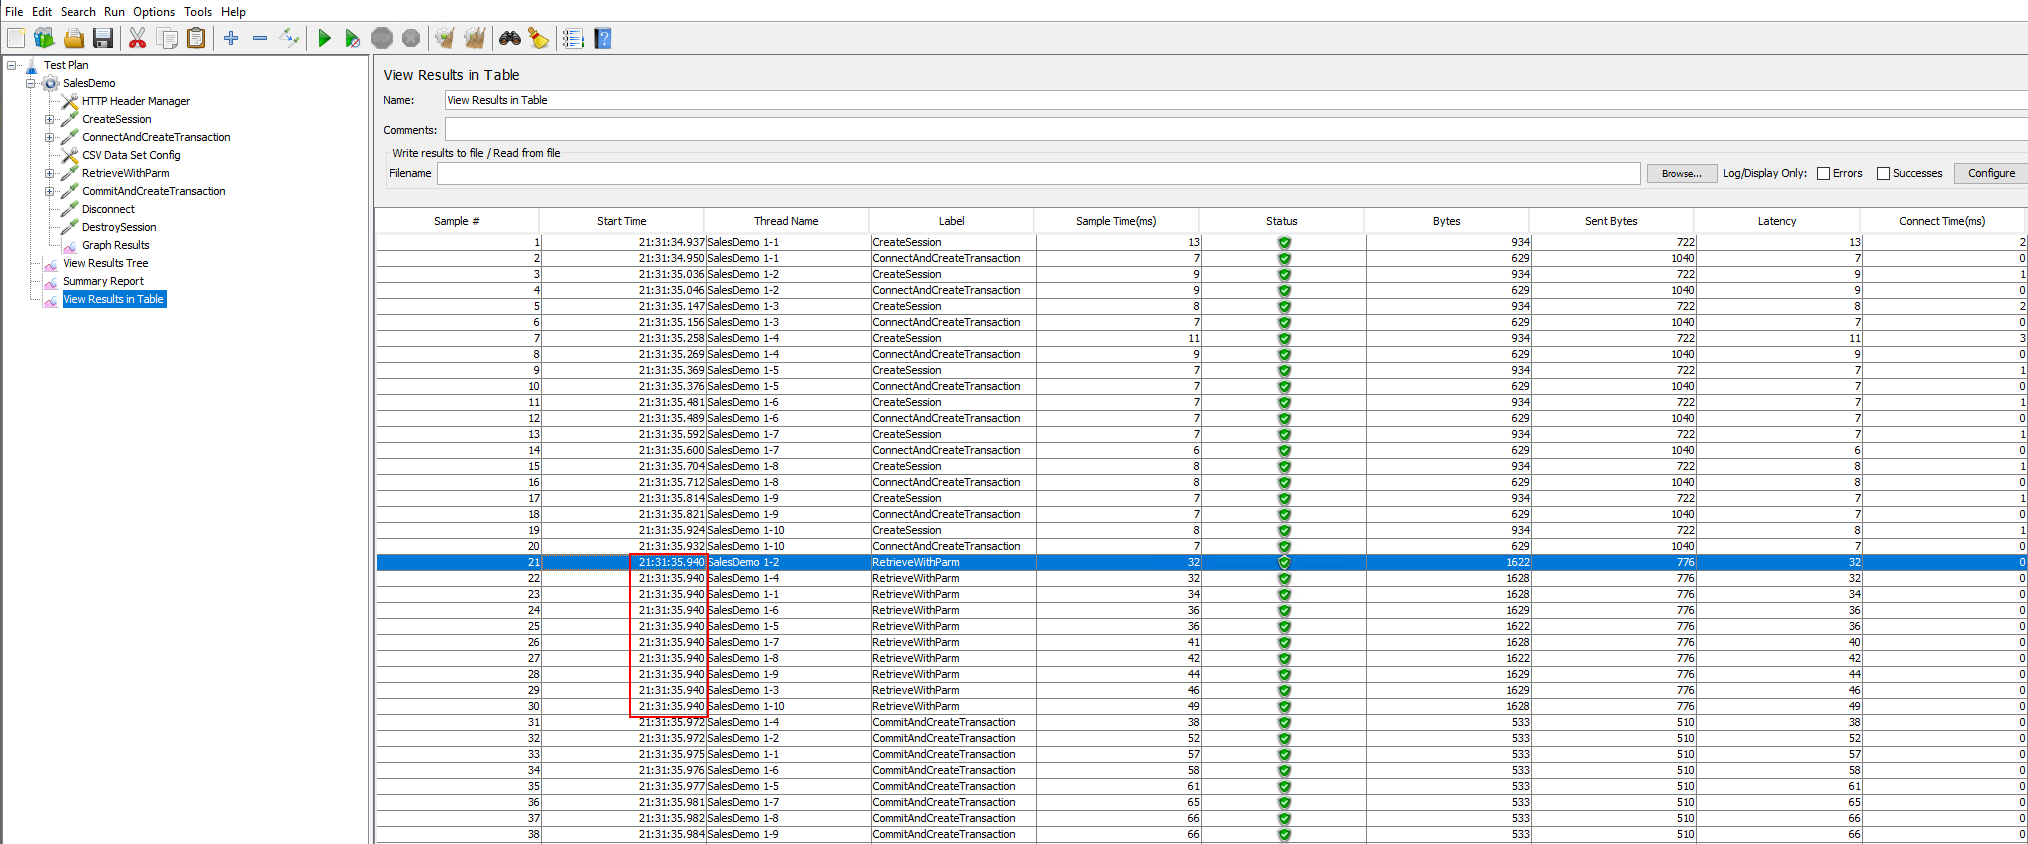
The View Result Tree in Table listener displays the information of the request in the form of a table, and in the order of time each request is made.
You can easily find out whether the requests are made simultaneously at the same point of time (for example, when Synchronizing Timer is added).
The Summary Report listener displays the performance matrices of each request, such as the number of samples processed, the average response time, throughput, error rate etc.

In this section, you will learn how to parameterize/correlate the session ID and transaction ID so that they are correlated with the dynamic values instead of static ones. You will learn more about parameterization and correlation for the access token, retrieval arguments, and ESQL parameters in the section called “Parameterization and correlation”.
This section will reuse the test plan and thread group that was just recorded in the section called “Recording scripts automatically (using Recorder)”.
Clean up the recorded test plan by removing any duplicated and unnecessary requests. Suppose the test plan looks like this after cleanup:
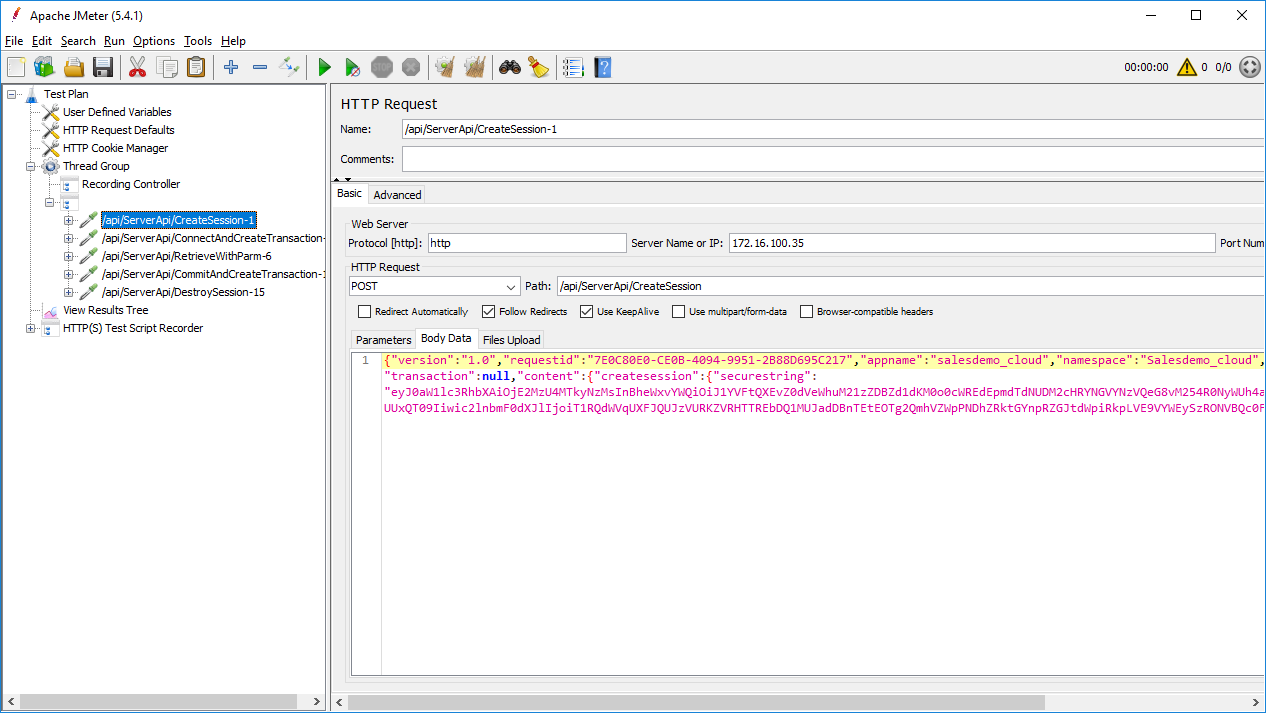
Now you will add two other thread groups:
-
setUp Thread Group: contains the pre-test actions such as creating the session, connecting to the database, starting the transaction etc. Normally the setUp Thread Group runs only once.
-
tearDown Thread Group: contains the post-test actions such as committing a transaction, disconnecting from the database, destroying the session etc. Normally the tearDown Thread Group runs only once.
The setUp Thread Group is used when you need to run initial actions to prepare the testing environment, prior to starting your main test. These actions should be configured within the setUp Thread Group and not within the regular Thread Group that you will use for running your load test.
In this tutorial, you will run the following pre-test actions via setUp Thread Group:
-
Create the user session
-
Connect to the database
-
Start the transaction
To add a setUp Thread Group to the test plan, right click on the test plan that you added just now, and then select Add > Threads (Users) > setUp Thread Group.
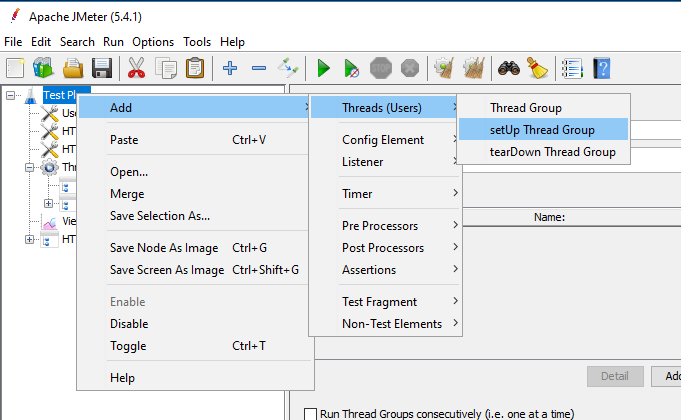
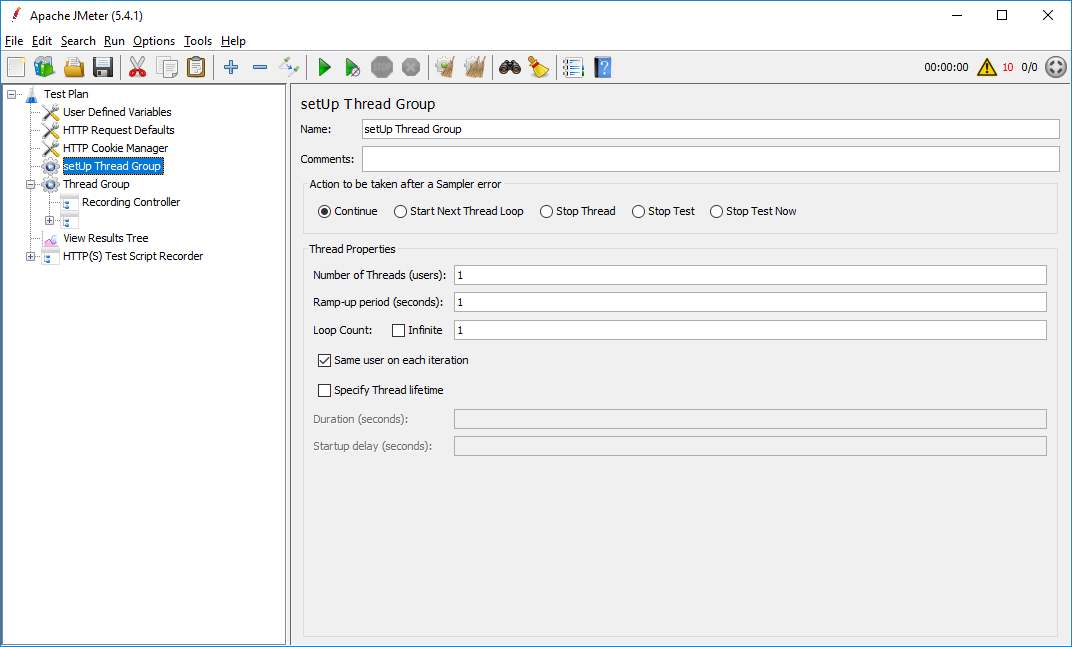
Make sure this setUp Thread Group is listed as the first thread group under the test plan, so it starts before the other thread groups. You can drag the item in the tree to adjust their level and order.
You can use the default settings for the setUp Thread Group.
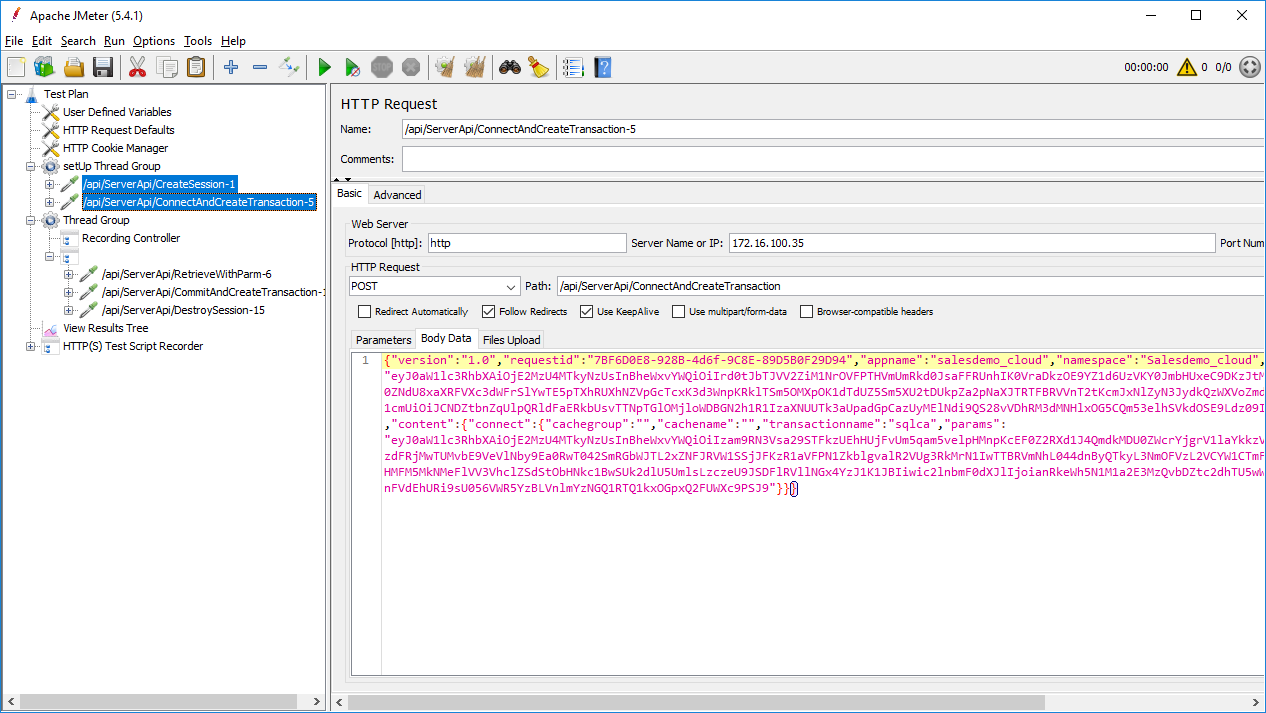
Now you can move (by drag & drop) the following HTTP requests from Thread Group to the setUp Thread Group.
To correlate the session ID, you can first add a Regular Expression Extractor to save the session ID to a local variable; and then add a BeanShell PostProcessor to set the local variable as a global property, so that it can be shared in all thread groups.
To add a Regular Expression Extractor, right click on the CreateSession request and then select Add > Post Processors > Regular Expression Extractor.
Specify the Regular Expression Extractor like this.
-
Name of created variable: “session” or any name you prefer
-
Regular Expression: "sessionid":"(.+?)"
-
Template: $1$
-
Match No.: 1
The session ID will be saved to the “session”
variable.

To add a BeanShell PostProcessor, right click on the CreateSession request, and then select Add > Post Processors > BeanShell PostProcessor.
Input the following script:
${__setProperty(session,${session},)}
The “session” variable can be accessed as a
JMeter global property.

Use the Search menu to
search for all occurrences of “session” in all thread groups, and
then replace the static value of session ID with the global
property ${__property(session,,)}.
Similar to the session ID, you can first add a Regular Expression Extractor to save the transaction ID into a local variable; and then add a BeanShell PostProcessor to set the local variable as a global property, so that it can be shared in all thread groups.
To add a Regular Expression Extractor, right click on the ConnectAndCreateTransaction request and then select Add > Post Processors > Regular Expression Extractor.
Specify the Regular Expression Extractor like this:
-
Name of created variable: “transaction” or any other name you prefer
-
Regular Expression: "transactionid":"(.+?)"
-
Template: $1$
-
Match No.: 1
The transaction ID will be saved to the
“transaction” variable.

To add a BeanShell PostProcessor, right click on the ConnectAndCreateTransaction request and then select Add > Post Processors > BeanShell PostProcessor.
Input the following script:
${__setProperty(transaction,${transaction},)}
The “transaction” variable can be accessed as a
JMeter global property.
Use the Search menu to
search for all occurrences of “transactionid” in all thread
groups, and then replace the static value of transaction ID with
the global property
${__property(transaction,,)}.
The tearDown Thread Group is used to perform post-test actions. These actions should be configured within the tearDown Thread Group and not within the regular Thread Group that you will use for running your load test.
In this tutorial, you will run the following post-test actions via tearDown Thread Group:
-
Commit the transaction
-
Destroy the user session
To add a tearDown Thread Group to the test plan, right click on the test plan that you added just now, and then select Add > Threads (Users) > tearDown Thread Group.
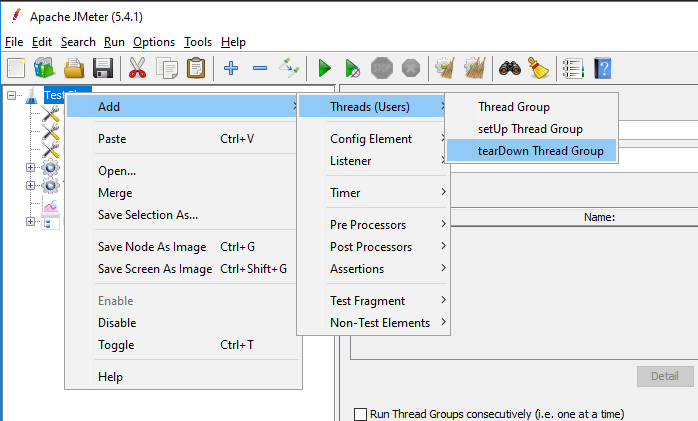
Make sure this tearDown Thread Group is listed after Thread Group, so it starts when Thread Group has finished.
You can use the default settings for the tearDown Thread Group. Normally the tearDown Thread Group runs only once.
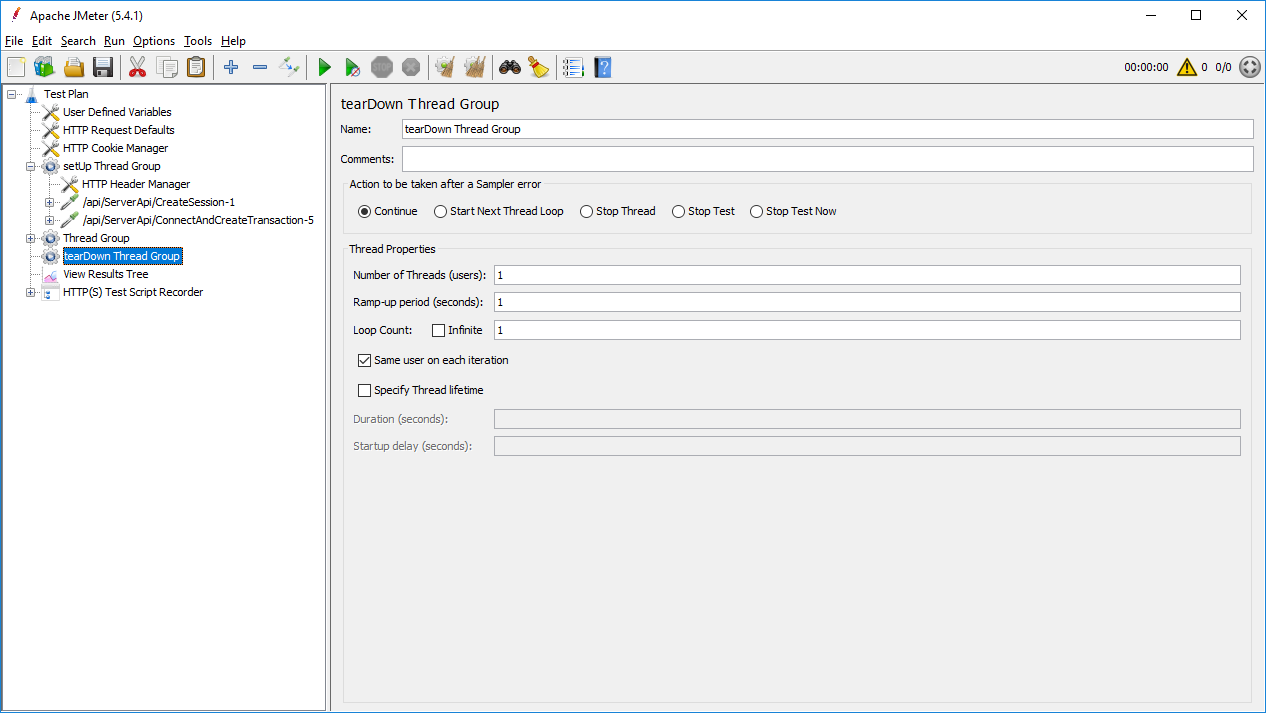
Now you can move (by drag & drop) the following HTTP requests from Thread Group to the setUp Thread Group.
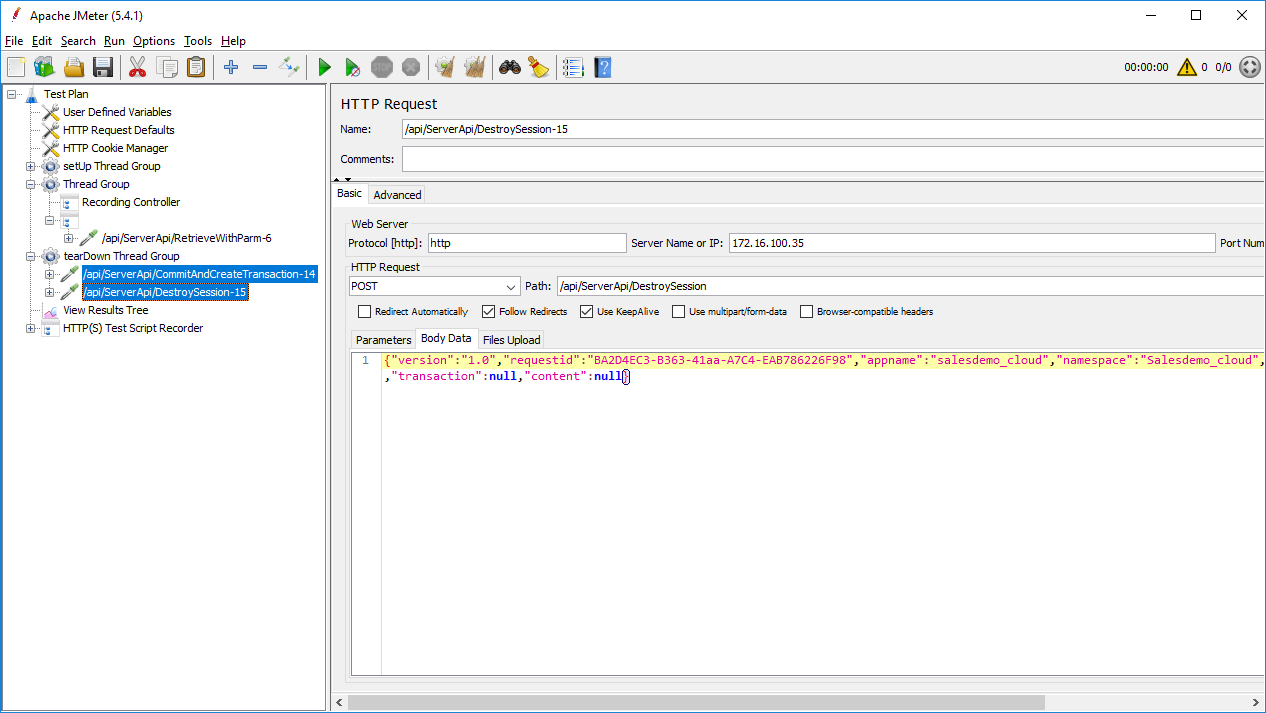
You can first add a Regular Expression Extractor to save the transaction ID into a local variable; and then add a BeanShell PostProcessor to set the local variable as a global property, so that it can be shared in all thread groups.
To add a Regular Expression Extractor, right click on the CommitAndCreateTransaction request and then select Add > Post Processors > Regular Expression Extractor.
Specify the Regular Expression Extractor like this:
-
Name of created variable: “transaction” or any other name you prefer
-
Regular Expression: "transactionid":"(.+?)"
-
Template: $1$
-
Match No.: 1
The transaction ID will be saved to the
“transaction” variable.

To add a BeanShell PostProcessor, right click on the CommitAndCreateTransaction request and then select Add > Post Processors > BeanShell PostProcessor.
Input the following script:
${__setProperty(transaction,${transaction},)}
The “transaction” variable can be accessed as a
JMeter global property.
Use the Search menu to
search for all occurrences of “transactionid” in all thread
groups, and then replace the static value of transaction ID with
the global property
${__property(transaction,,)}.
After moving requests to the setUp Thread Group and the tearDown Thread Group, now the regular Thread Group contains only one RetrieveWithParm request.
Go to the Body Data of the RetrieveWithParm request, and make sure the session ID and the transaction ID are replaced with the global property:
${__property(session,,)}
${__property(transaction,,)}

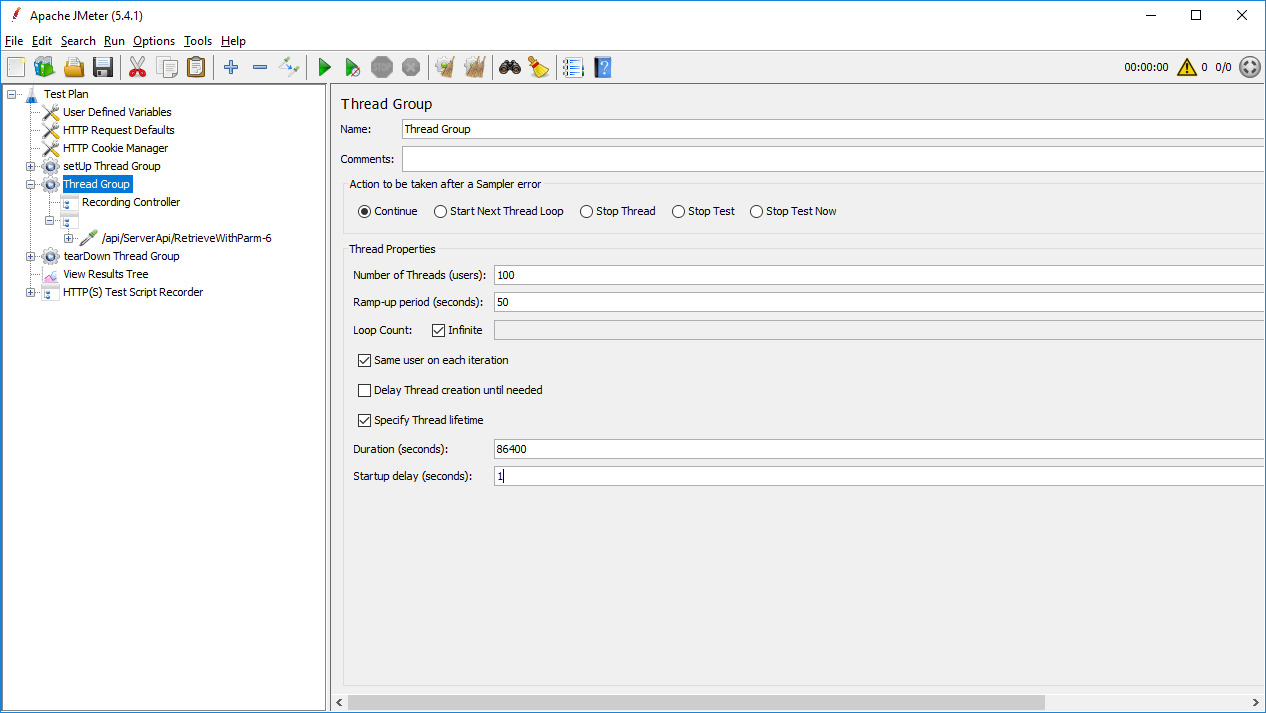
Configure the Thread Group according to your needs.
For example, set the number of users to 100, ramp-up period to 50 seconds, which means 2 requests are made in every second (set ramp-up to 0 will start all 100 users at one time). Set loop count to infinite and duration to 86400 seconds, which means the test will be run repeatedly in 24 hours.
"Simultaneous users" are users making the same requests at the exact same point of time.
In JMeter, you can use Synchronizing Timer to simulate users making requests simultaneously. The purpose of Synchronizing Timer is to hold the threads until X number of threads have arrived and then release them all at once.
This section will walk you through how to add a Synchronizing Timer and verify the results.
Step 1: Suppose you have created a test plan for the Sales Demo application and you have correlated the session ID and the transaction ID.
Note that the session ID and the transaction ID must be referenced as variables (which are local to the thread group), and cannot be referenced as properties (which are global to all thread groups). Therefore you should not add the BeanShell Sampler or BeanShell PostProcessor to set the variable as a property, or add other thread groups such as setUp Thread Group or tearDown Thread Group.
For example, you should directly input ${session}
or ${transaction} in the scripts, instead of referencing
${__property(session,,)} or
${__property(transaction,,)}.
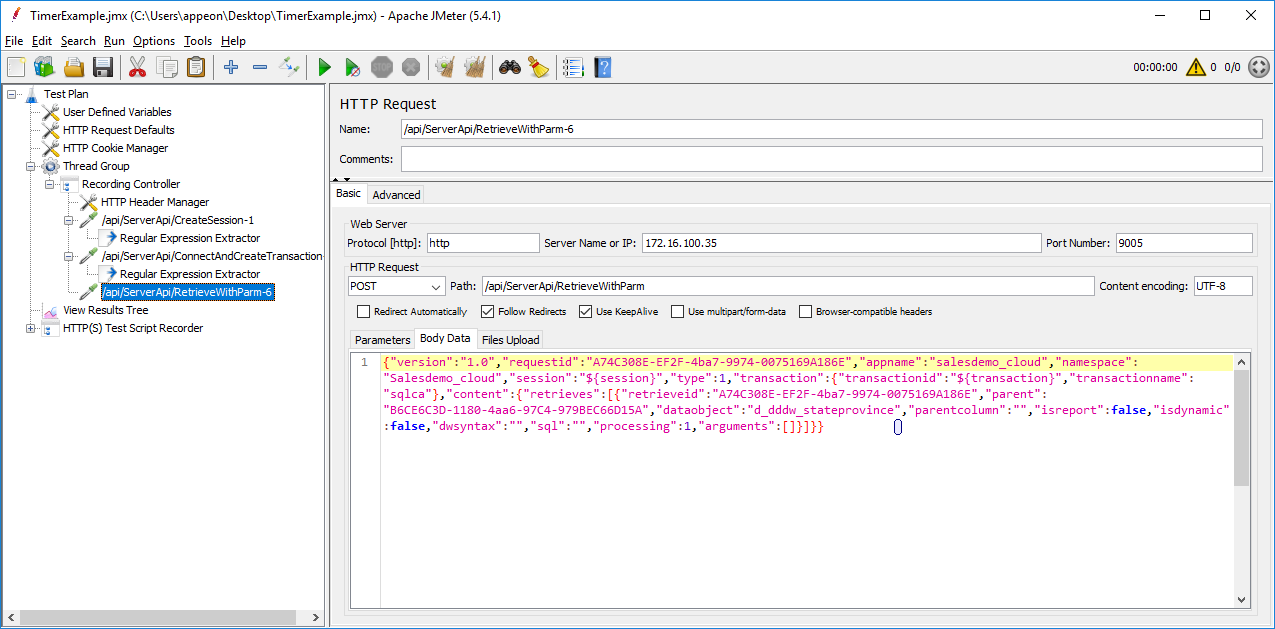
Step 2: Configure the thread group according to your needs.
For example, set the number of users to 5, ramp-up period to 2 seconds, and loop count to 1.
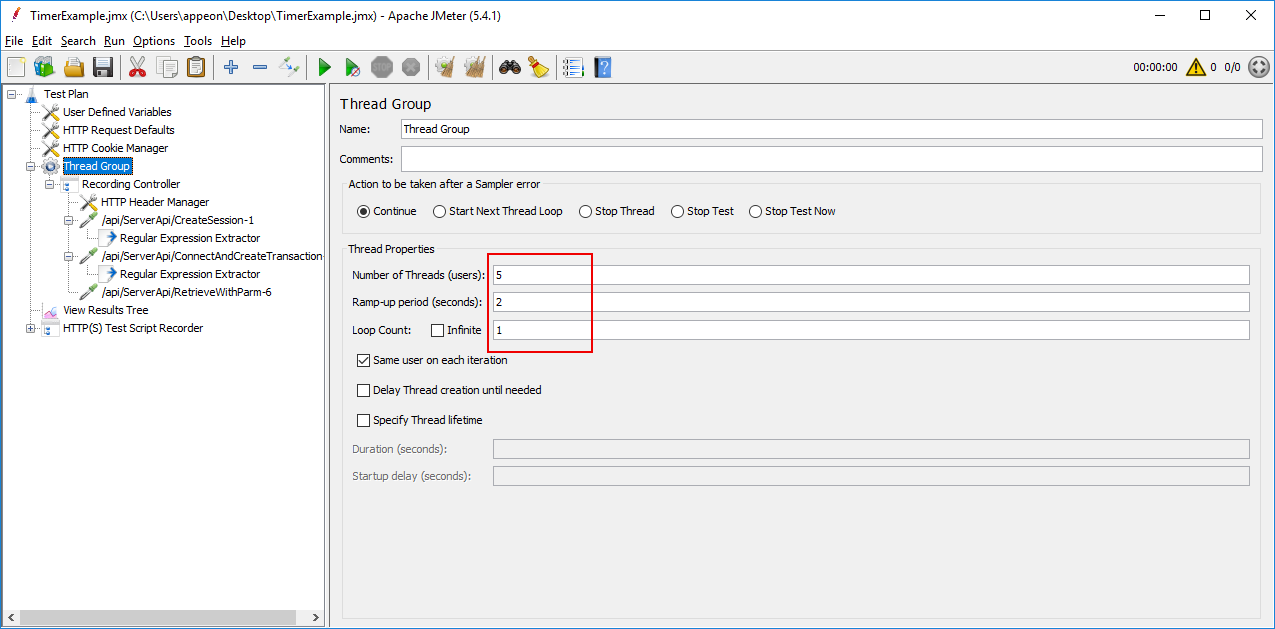
Step 3: Add a Synchronizing Timer under the RetrieveWithParm request.
To add a Synchronizing Timer, right click on the RetrieveWithParm request, and then select Add > Timer > Synchronizing Timer.
Keep the default values. This indicates that JMeter will release the same number of users defined in the thread group (which is 5 in this demo).
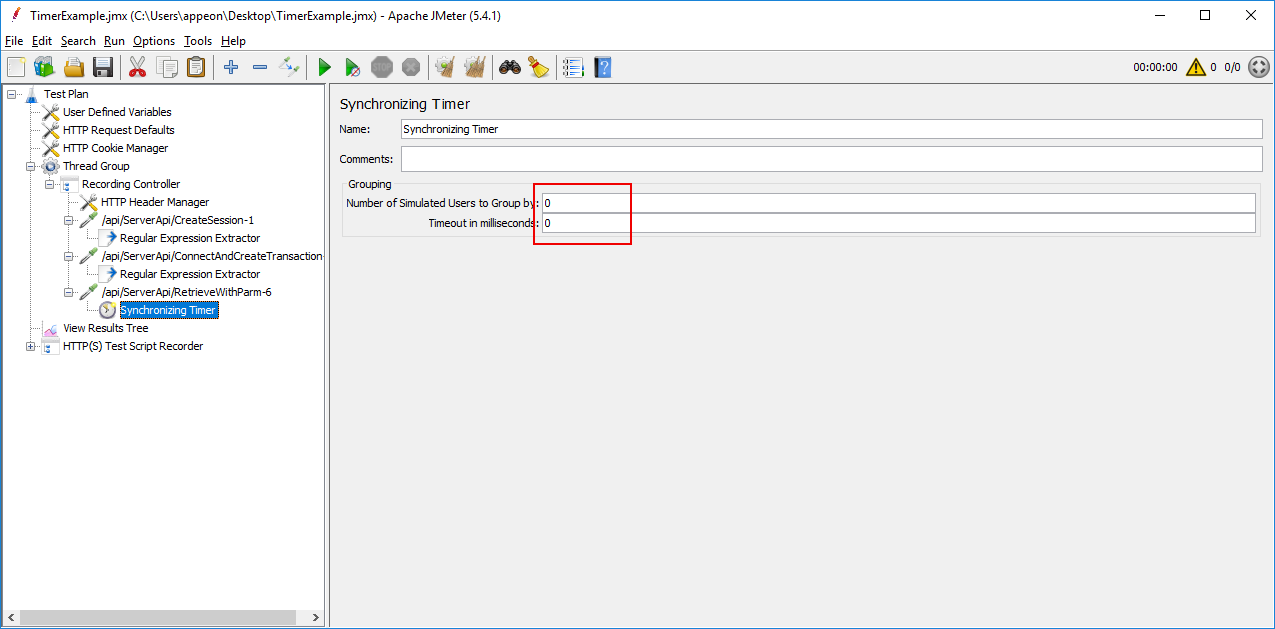
Step 4: Add a View Results in Table listener under the test plan.
To add a View Results in Table listener, right click on the test plan, and the select Add > Listener > View Results in Table.
This listener can display the information of the request in the form of a table, and in the order of time each request is made.
Step 5: Click Start on the toolbar to run the test.
Step 6: Click View Results in Table to verify that all RetrieveWithParm requests are made at the same exact point of time.
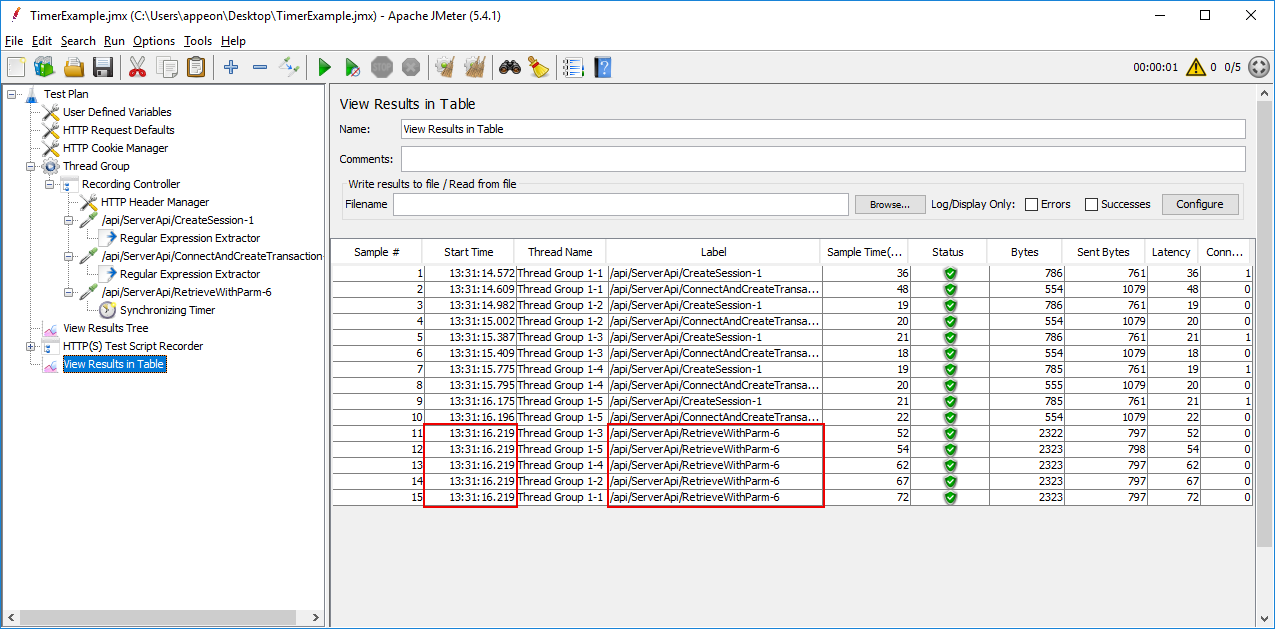
Step 7: Click View Results Tree to verify that the session ID and the transaction ID are dynamic values in the request body or response data.
