When an application is suspended at a breakpoint, use QuickWatch, TipWatch, and the Variables, Watch, Call Stack, and Objects in Memory views to examine its state.
About icons used in debugging views
The Variables, Watch, and Objects in Memory views use many of the icons used in the PowerBuilder Browser as well as some additional icons: I represents an Instance; F, a field; A, an array; and E, an expression.
The debugger provides three different ways to examine the values of variables: TipWatch, QuickWatch, and the Variables view.
TipWatch
TipWatch is a quick way to get the current value of a variable of a simple datatype. When execution stops at a breakpoint, you can place the edit cursor over a variable in the Source view to display a pop-up tip window that shows the current value of that variable. You can also select a simple expression to display its current value.
TipWatch has some limitations: if the variable you select is an object type, the tip window shows only an internal identifier. For array types, it shows {...} to indicate that more information is available. To show complete information for object type and array type variables, use QuickWatch instead.
TipWatch does not evaluate function, assignment, or variable value modification expressions. If TipWatch cannot parse the string you select, the pop-up window does not display.
Remote debugging
When you are debugging a remote component, Tip Watch does not evaluate expressions or indirect variables.
QuickWatch provides the current value of simple variables and detailed information about object variables, including the values of all fields in the variable. QuickWatch can also evaluate function expressions, and you can use it to change the values of variables, evaluate expressions, and add variables and expressions to the Watch view.
Exercise caution when evaluating expressions
QuickWatch evaluates all kinds of expressions, including functions, in local debugging. If you select a function and activate QuickWatch, the function is executed. This may have unexpected results. For example, if you select dw_1.print() and activate QuickWatch, the DataWindow is printed.
To open the QuickWatch dialog box
-
When execution stops at a breakpoint, move the edit cursor to a variable or select an expression in the Source view, and do one of the following:
-
Select QuickWatch from the Debug or pop-up menu
-
Press Shift+F9
-
To change the value of a variable from the QuickWatch dialog box
-
Select an item in the tree view and do one of the following:
-
Click Change Value
-
Double-click the tree view item
-
-
In the Modify Variable dialog box, type a new value for the variable in the New Value box, or select the Null check box to set the value of the variable to null, and click OK.
-
Close the QuickWatch dialog box and continue debugging the application with the variable set to the new value.
To evaluate an expression in the QuickWatch dialog box and add it to the Watch view
-
Change the variable or expression in the Expression box.
-
Click Reevaluate to display the new value in the tree view.
-
(Optional) Click Add Watch to add the expression to the Watch view.
Remote debugging
When you are debugging a remote component, expressions and indirect variables are not evaluated, and you cannot modify variable values.
Using Variables views
Each Variables view shows one or more types of variables in an expandable outline. Double-click the variable names or click on the plus and minus signs next to them to expand and contract the hierarchy. If you open a new Variables view, it shows all variable types.
|
Variable type |
What the Variables view shows |
|---|---|
|
Local |
Values of variables that are local to the current script or function |
|
Global |
Values of all global variables defined for the application and properties of all objects (such as windows) that are open |
|
Instance |
Properties of the current object instance (the object to which the current script belongs) and values of instance variables defined for the current object |
|
Parent |
Properties of the parent of the current instance |
|
Shared |
Objects, such as application, window, and menu objects, that have been opened and the shared variables associated with them |
About Instance and Parent variables
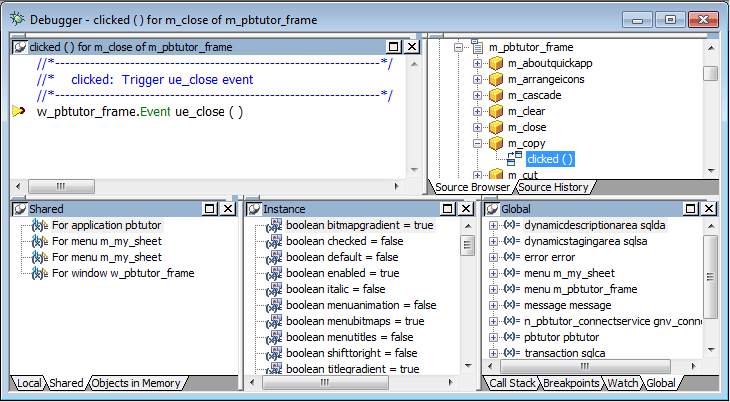
In the following illustration, an application has stopped at a breakpoint in the script for the Clicked event for the Close menu item on a frame's File menu. The Instance Variables view shows the properties of the current instance of the Close menu item. The Parent Variables view shows the properties of its parent, an instance of the File menu. Navigating through the hierarchy in the Global Variables view shows the same objects.
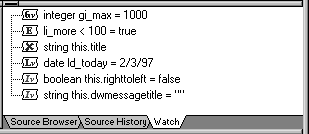
The Watch view lets you monitor the values of selected variables and expressions as the application runs.
If the variable or expression is in scope, the Watch view shows its value. Empty quotes indicate that the variable is in scope but has not been initialized. A pair of glasses in the Watch view indicates that the variable or expression is not in scope.
Setting variables and expressions in the Watch view
You can select variables you want to watch as the application runs by copying them from a Variables view. You can also set a watch on any PowerScript expression. When you close the debugger, any watch variables and expressions you set are saved.
Using QuickWatch
You can also add variables and expressions to the Watch view from the QuickWatch dialog box. See QuickWatch.
To add a variable to the Watch view
-
Select the variable in the Variables view.
-
Do one of the following:
-
Drag the variable to the Watch view
-
Click the Add Watch button on the PainterBar
-
Select Debug>Add Watch from the menu bar
PowerBuilder adds the variable to the watch list.
-
To add an expression to the Watch view
-
Select Insert from the pop-up menu.
-
Type any valid PowerScript expression in the New Expression dialog box and click OK.
PowerBuilder adds the expression to the watch list.
To edit a variable in the Watch view
-
Select the variable you want to edit.
-
Double-click the variable, or select Edit Variable from the pop-up menu.
-
Type the new value for the variable in the Modify Variable dialog box and click OK.
To edit an expression in the Watch view
-
Select the expression you want to edit.
-
Double-click the expression, or select Edit Expression from the pop-up menu.
-
Type the new expression in the Edit Expression dialog box and click OK.
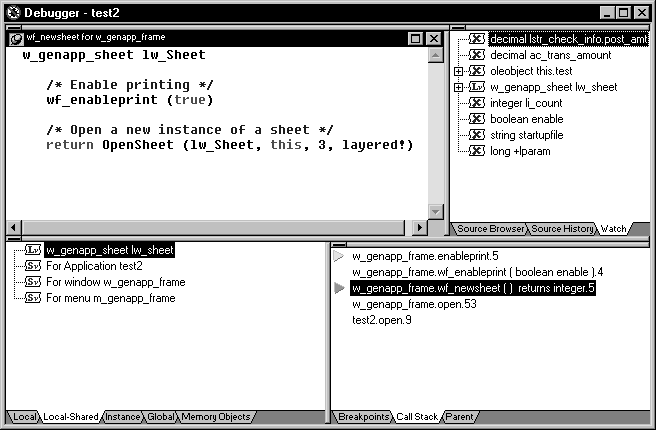
The Call Stack view shows the sequence of function calls leading up to the script or function that was executing at the time of the breakpoint. Each line in the Call Stack view displays the name of the script and the line number from which the call was made. The yellow arrow shows the script and line where execution was suspended.
You can examine the context of the application at any line in the call stack.
To show a different context from the Call Stack view
-
Select a line in the Call Stack view.
-
Do one of the following:
-
Double-click the line
-
Select Set Context from the pop-up menu
-
Drag the line into the Source view
A green arrow indicates the script that you selected. The Source view shows the script and line number you selected, and the Variables and Watch views show the variables and expressions in scope in that context.
-
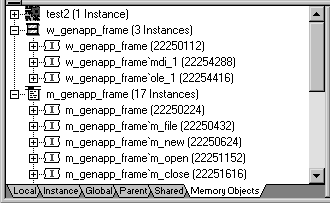
The Objects in Memory view shows an expandable list of objects currently in memory. Double-click the name of an object or click the plus sign next to it to view the names and memory locations of instances of each object and property values of each instance.
The Source view displays the full text of a script. As you run or step through the application, the Source view is updated to show the current script with a yellow arrow indicating the next statement to be executed.
Multiple Source views
You can open more than one source view. If there are multiple source views open, only the first one opened is updated to show the current script when the context of an application changes.
Copying from the Source view
When text is selected in the Source view, you can select Copy from the pop-up menu in the Source view to copy the string to the clipboard. You can then paste the string into another dialog box to search for the string, insert a watch, or add a conditional breakpoint.
Changing the Source view
From the pop-up menu, you can navigate backward and forward through the scripts that have been opened so far, open ancestor and dependent scripts, and go to a specific line in the current script. There are several other ways to change the script from other views or from the menu bar.
To change the script displayed in a Source view
-
Do one of the following:
-
Drag the name of a script to the Source view from the Call Stack, Source Browser, or Source History views
-
Select a line and then select Open Source from the pop-up menu in the Breakpoints, Source Browser, or Source History views
-
Select Edit>Select Script from the menu bar
-
The Source Browser shows all the objects in your application in an expandable hierarchy. It provides a view of the structure of the application and a quick way to open any script in the Source view.
To open a script from the Source Browser
-
Double-click the object that the script belongs to or click the plus sign next to the object to expand it.
-
Do one of the following:
-
Double-click the script
-
Select the script and select Open Source from the pop-up menu
-
Drag the script onto a Source view
When you double-click or select Open Source, a new Source view opens if there was none open. If several Source views are open, the script displays in the view that was used last.
-
The Source History view lists all the scripts that have been opened in the current debugging session. Use the same techniques as in the Source Browser view to display a selected script in the Source view.
Source History limit
The Source History view shows up to 100 scripts and is not cleared at the end of each debugging run. It is cleared when you close the debugger, or you can clear the list from the pop-up menu.


