Graphs have two or three axes. You specify the axes' properties in the Axis page in the graph's Properties view.
To specify properties for an axis of a graph
-
Select Properties from the graph's pop-up menu and then select the Axis page in the Properties view.
-
Select the Category, the Value, or the Series axis from the Axis drop-down list.
If you are not working with a 3D graph, the Series Axis options are disabled.
-
Specify the properties as described next.
Specifying text properties
You can specify the characteristics of the text that displays for each axis. The following table shows the two kinds of text associated with an axis.
|
Type of text |
Meaning |
|---|---|
|
Text |
Text that identifies the values for an axis. |
|
Label |
Text that describes the axis. You specify the label text in a painter. You can use ~n to embed a new line within a label. |
For information on specifying properties for the text, see Specifying text properties for titles, labels, axes, and legends.
Specifying datatypes
The data graphed along the Value, Category, and Series axes has an assigned datatype. The Series axis always has the datatype String. The Value and Category axes can have the datatypes listed in the following table.
|
Axis |
Possible datatypes |
|---|---|
|
Both axes (for scatter graph) |
Number, Date, Time |
|
Value (other graph types) |
Number, Date, DateTime, Time |
|
Category (other graph types) |
String, Number, Date, DateTime, Time |
For graphs in DataWindow objects, PowerBuilder automatically assigns the datatypes based on the datatype of the corresponding column; you do not specify them.
For graphs in windows, you specify the datatypes yourself. Be sure you specify the appropriate datatypes so that when you populate the graph (using the AddData method), the data matches the datatype.
Scaling axes
You can specify the properties listed in the following table to define the scaling used along numeric axes.
|
Property |
Meaning |
|---|---|
|
Autoscale |
If selected (the default), PowerBuilder automatically assigns a scaling for the numbers along the axis. |
|
RoundTo, RoundToUnit |
Specifies how to round the end points of the axis (note that this just rounds the range displayed along the axis; it does not round the data itself). You can specify a number and a unit. The unit is based on the datatype; you can specify Default as the unit to have PowerBuilder decide for you. For example, if the Value axis is a Date column, you can specify that you want to round the end points of the axis to the nearest five years. In this case, if the largest data value is the year 1993, the axis extends up to 1995, which is 1993 rounded to the next highest five-year interval. |
|
MinimumValue, MaximumValue |
The smallest and largest numbers to appear on the axis (disabled if you have selected Autoscale). |
|
ScaleType |
Specifies linear or logarithmic scaling (common or natural). |
|
ScaleValue |
Specifies whether values are displayed as actual values or as a cumulative value, a percentage, or a cumulative percentage. |
Using major and minor divisions
You can divide axes into divisions. Each division is identified by a tick mark, which is a short line that intersects an axis. In the Sales by Printer graphs shown in Examples, the graph's Value axis is divided into major divisions of 50 units each. PowerBuilder divides the axes automatically into major divisions.
To define divisions for an axis of a graph
-
To divide an axis into a specific number of major divisions, type the number of divisions you want in the MajorDivisions box.
-
Leave the number 0 to have PowerBuilder automatically create divisions. PowerBuilder labels each tick mark in major divisions. If you do not want each tick mark labeled, enter a value in the DisplayEveryNLabels box. For example, if you enter 2, PowerBuilder labels every second tick mark for the major divisions.
-
To use minor divisions, which are divisions within each major division, type the appropriate number in the MinorDivisions box. To use no minor divisions, leave the number 0.
When using logarithmic axes
If you want minor divisions, specify 1; otherwise, specify 0.
Representing divisions with grid and drop lines
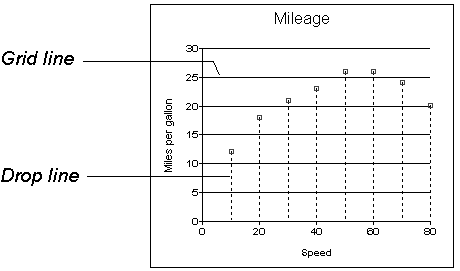
You can specify lines to represent the divisions as described in the following table and illustrated in the following figure.
|
Line |
Meaning |
|---|---|
|
Grid line |
A line that extends from a tick mark across the graph. Grid lines make graphs easier to read. |
|
Drop line |
A line that extends vertically from a data point to its axis (not available for all graph types). |
Using line styles
You can define line styles for the components of a graph listed in The following table.
|
Component |
Meaning |
|---|---|
|
PrimaryLine |
The axis itself |
|
SecondaryLine |
The axis parallel to and opposite the primary axis |
|
OriginLine |
A grid line that represents the value zero |
|
Frame |
The frame for the axis in 3D graphs (disabled for 2D graphs) |
