The following topics provide examples that illustrate using DataWindow expression functions.
A null value is a marker used to fill a place in a column where data is missing for any reason. The value might not be applicable, or it might be missing or unknown. When a database table is created, each column in the table either allows null values or does not allow them. The column or set of columns that define the primary key cannot allow null values. Sometimes it is useful to know how many null values there are in a particular column.
What you want to do
Suppose you are working with the Fin_code table in the Enterprise Application Sample Database. The Fin_code table has three columns:
|
Column |
What the column is |
Allows null values? |
|---|---|---|
|
Code |
Unique financial identifier (primary key) |
No |
|
Type |
Code type: expense or revenue |
No |
|
Description |
Code description: the department incurring the expense or getting the revenue |
Yes |
You create a report using the Code and Description columns. You want to know the number of null values in the Description column.
How to do it
In the report, you create a computed field that uses functions to display the number of null values in the Description column.
For the sake of demonstrating the use of functions, the following computed fields are created in the Summary band of the report (with text objects that tell you what information each computed field is providing):
Count(description for all)
counts the number of descriptions (that are not null);
Sum(If(IsNull(description), 1, 0))
returns a 1 if the description column is null, a 0 if the description column is not null, and then adds the total;
Count(id for all)
counts the number of IDs (which is also the number of rows);
Sum(If(IsNull(description), 1, 1))
adds the number of nulls and not nulls in the description column (which is the total number of rows) and should match the result of the
Count( id for all ) function; and
IsNull(description)
evaluates whether the last row in the table has a description that is null. The return value of the IsNull function is true or false.
What you get
Here is the design for the report.

Here is the report showing eight descriptions, three of which are null and five of which are not null. The last description for Id=8 is null.
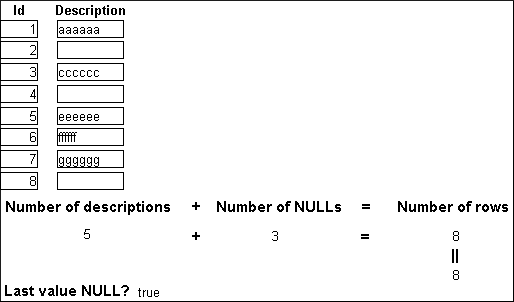
Example 1 demonstrates the use of the Sum and Count functions. Sum and Count are two examples of a class of functions called aggregate functions.
An aggregate function is a function that operates on a range of values in a column. The aggregate functions are:
|
Avg |
Large |
Mode |
Sum |
|
Count |
Last |
Percent |
Var |
|
CumulativePercent |
Max |
Small |
VarP |
|
CumulativeSum |
Median |
StDev |
|
|
First |
Min |
StDevP |
|
About crosstab functions
Although the crosstab functions (CrosstabAvg, CrosstabAvgDec, CrosstabCount, CrosstabMax, CrosstabMaxDec, CrosstabMin, CrosstabMinDec, CrosstabSum, and CrosstabSumDec) behave like aggregate functions, they are not included on the list because they are for crosstabs only and are designed to work in the crosstab matrix.
A few restrictions apply to the use of aggregate functions. You cannot use an aggregate function:
-
In a filter
-
In a validation rule
-
As an argument for another aggregate function
This example demonstrates the use of the Sum aggregate function.
What you want to do
Using the employee table in the PB Demo DB as the data source, you create a report using at least the Emp_id and the Sex columns. You want the report to display the number of male employees and female employees in the company.
How to do it
In the summary band in the workspace, add two computed fields to the report that use the Sum and If functions:
Sum(If(sex = "M", 1, 0))
counts the number of males in your company;
Sum(If(sex = "F", 1, 0))
counts the number of females in your company.
By clicking the Page computed field button, you can also add a Page computed field in the footer band to display the page number and total pages at the bottom of each page of the report.
What you get
Here is what the design of the report looks like.
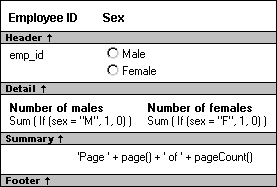
Here is the last page of the report, with the total number of males and females in the company displayed.
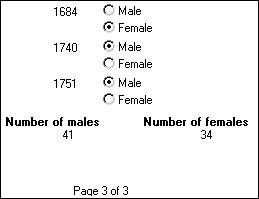
If you want more information
What if you decide that you also want to know the number of males and females in each department in the company?
To display the males and females in each department:
-
Select Design>Data Source from the menu bar so that you can edit the data source.
-
Select Design>Select tables from the menu bar and open the Department table in the Select painter workspace, which currently displays the Employee table with the Emp_id and Sex columns selected.
-
Select the department_dept_name column to add it to your data source.
-
Select Rows>Create Group from the menu bar to create a group and group by department name.
-
In the trailer group band, add two additional computed fields:
Sum(If(sex = "M", 1, 0) for group 1)
counts the number of males in each department;
Sum(If(sex = "F", 1, 0) for group 1)
counts the number of females in each department.
Here is what the design of the grouped report looks like.
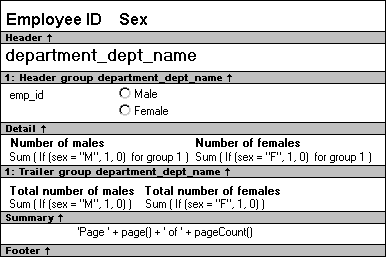
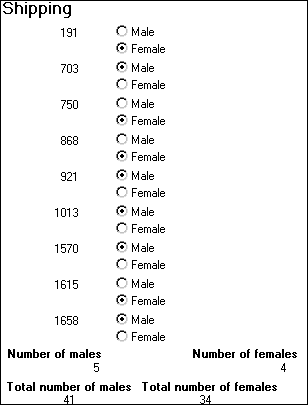
Here is the last page of the report with the number of males and females in the shipping department displayed, followed by the total number of males and females in the company.
This example demonstrates the use of several functions: Bitmap, Case, CurrentRow, GetRow, and RGB.
The example is presented in the DataWindow painter, which is the same as InfoMaker's Report painter. You can use all the functions shown in the example in the Report painter. However, because you can change the current row and change data in a DataWindow object (which you cannot do in a report), the example is more interesting to consider in a DataWindow object.
What you want to do
Using the Employee table in the Enterprise Application Sample Database, you create a DataWindow object using the Emp_id, Emp_fname, Emp_lname, and Salary columns.
In the painter, you want to display a number of items such as the number of the current row, an arrow that is an indicator of the current row, and the salary for an employee with a background color that depends on what the salary is.
How to do it
In the workspace, add the following:
-
A computed field CurrentRow( ), which displays the number of the current row.
-
A picture object, which is a right-arrow, for which you define an expression for the arrow's visible property:
If(CurrentRow()= GetRow(), 1, 0)
The expression causes an arrow to display in the current row and no arrow to display in other rows.
-
A computed field using the If, CurrentRow, and GetRow functions:
If(CurrentRow() = GetRow(),"Current","Not current")
displays the word "Current" when the row is the current row and "Not current" for all other rows.
-
A computed field (typed on one line) using the Bitmap, CurrentRow, and GetRow functions:
Bitmap(If(CurrentRow()= GetRow(), "c:\sampl\ex\code\indicatr.bmp", " "))
displays an arrow bitmap for the current row and no bitmap for all other rows.
-
An expression for the Background.Color property of the salary column:
Case(salary WHEN IS >60000 THEN RGB(192,192,192)
WHEN IS >40000 THEN RGB(0,255,0) ELSERGB(255,255,255))
The expression causes a salary above $40,000 to display in green, a salary above $60,000 to display in gray, and all other salaries to display in white.
What you get
Here is what the design of the report looks like:

Here is what the data looks like with the second row current.
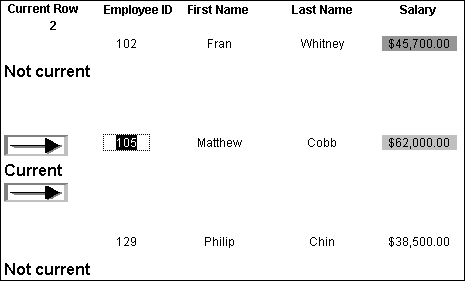
Notice that the number of the current row is 2; the first row and the third row are "Not current" (and therefore display no bitmap); and the second row, which is the current row, displays the arrow row indicator.
On your screen, the salary in the first row has a green background because it is more than $40,000; the salary in the second row has a gray background because it is more than $60,000; and the salary in the third row has a white background, which matches the background of the report.
When you create an arithmetic expression that has a null value, the value of the expression is null. This makes sense, since null means essentially undefined and the expression is undefined, but sometimes this fact can interfere with what you want to display.
What you want to do
A table in your database has four columns: Id, Corporation, Address1, and Address2. The Corporation, Address1, and Address2 columns allow null values. Using this table as the data source, you create a report using the four columns. You now want the report to display both parts of the address, separated by a comma.
You create a computed field to concatenate Address1 and Address2 with a comma separator. Here is the expression that defines the computed field:
address1 + ", " + address2
When you preview the report, if either Address1 or Address2 is null, no part of the address displays because the value of the expression is null. To display a part of the address, you need to create a computed field that forces evaluation even if Address2 is null. Note that Address2 is assumed to have data only if Address1 has data for a particular row.
How to do it
In the detail band, create a computed field that uses the If and IsNull functions:
If(IsNull(address1 + address2), address1, address1
+ ", " + address2)
The computed field says this: if the concatenation of the addresses is null (because address2 is null), then display address1, and if it is not null, display both parts of the address separated by a comma.
What you get
Here is what the design of the report looks like. It includes both the computed field that does not work and the one that does.

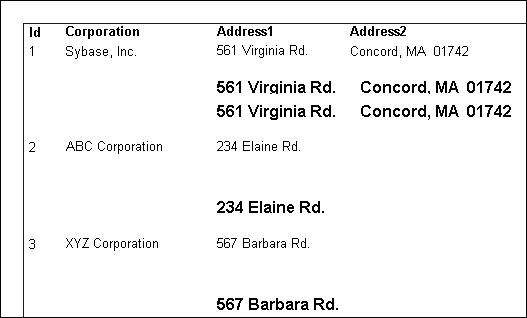
When you preview the report, notice that the first computed field displays null for ABC Corporation and XYZ Corporation. The second computed field displays the first part of the address, which is not null.
In InfoMaker, to see some examples of using functions, examine the reports and forms in TUTOR_IM.PBL, which is InfoMaker's sample library. The reports and forms were created using data in the PB Demo DB.
Look carefully at the reports whose names begin with attrib_. Each report is a good example of the use of functions in expressions. And look at the design of each report and form in the sample library to see the use of functions in other ways.
For more information
For examples of using expressions to control the value of properties at execution time, see the chapter on highlighting information in reports in the Users Guide.
For an example of the use of each InfoMaker function, see the function descriptions that follow.


