After you have created a trace file, the easiest way to analyze it is to use the profiling tools provided on the Tool tab of the New dialog box. There are three tools:
-
The Profiling Class View shows information about the objects that were used in the application
-
The Profiling Routine View shows information about all the routines (functions and events) that were used in the application
-
The Profiling Trace View shows the elapsed time taken by each activity in chronological order
Using the profiling tools as a model
Even if you want to develop your own analysis tools, using the profiling tools is a good way to learn about these models and about profiling in PowerBuilder. When you are ready to develop your own tools, see Analyzing trace information programmatically for an overview of the approaches you can take.
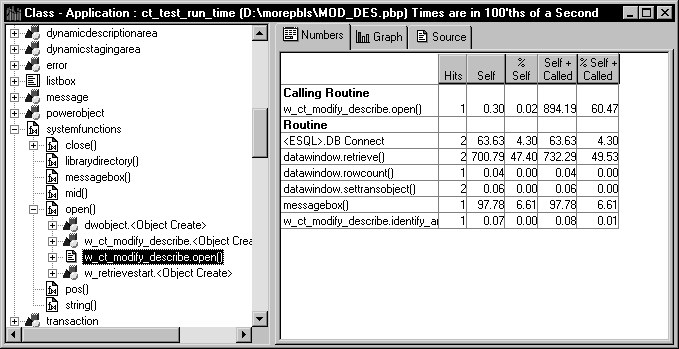
The Class view uses a TreeView control to display statistics for PowerBuilder objects, their functions, and their events. It displays statistics only for those objects that were active while tracing was enabled. The Class view has three tabs:
-
Numbers
Shows statistics only
-
Graph
Shows statistics in a bar graph
-
Source
Shows statistics and source code for those routines that originated in PowerScript source
For each object, the Class view shows all the routines called from each class with the number of times each routine was called (hit) as well as timing information for each call. The following illustration shows part of a Class view. Embedded SQL commands are shown as being called from a pseudo class called ESQL.
The Class view includes both PowerBuilder system-level objects (such as DataWindow and SystemFunction) and user-defined classes (such as windows and user objects). Each top-level node is a PowerBuilder class. As you expand the TreeView control, each node represents a routine and each subnode represents a called routine.
The Class view uses the call graph model to show cumulative statistics for objects, routines, and called routines. The information displayed on the right side of the display differs depending on the current node on the left.
|
Current node |
Statistics displayed |
|---|---|
|
Application |
Statistics for each object |
|
Object |
Cumulative statistics for the object and detailed statistics for the object's routines |
|
Routine |
Cumulative statistics for the routine and detailed statistics for called routines |
You can sort items on the right by clicking the heading.
Class view metrics
The Class view displays five metrics. The profiling tool accesses these metrics from instances of the ProfileCall and ProfileRoutine objects. The time scale you specified in the Preferences dialog box determines how times are displayed.
|
Metric |
What it means |
|---|---|
|
Hits |
The number of times a routine executed in a particular context. |
|
Self |
The time spent in the routine or line itself. If the routine or line was executed more than once, this is the total time spent in the routine or line itself; it does not include time spent in routines called by this routine. |
|
%Self |
Self as a percentage of the total time the calling routine was active. |
|
Self+Called |
The time spent in the routine or line and in routines or lines called from the routine or line. If the routine or line was executed more than once, this is the total time spent in the routine or line and in called routines or lines. |
|
%Self+Called |
Self+Called as a percentage of the total time that tracing was enabled. |
About percentages
The percentages captured in the trace file are based on the total time tracing was enabled. Because an application can be idle (while displaying a MessageBox, for example), percentage metrics are most meaningful when you control tracing programmatically, which can help to minimize idle time. Percentages are least meaningful when you create a trace file for a complete application.
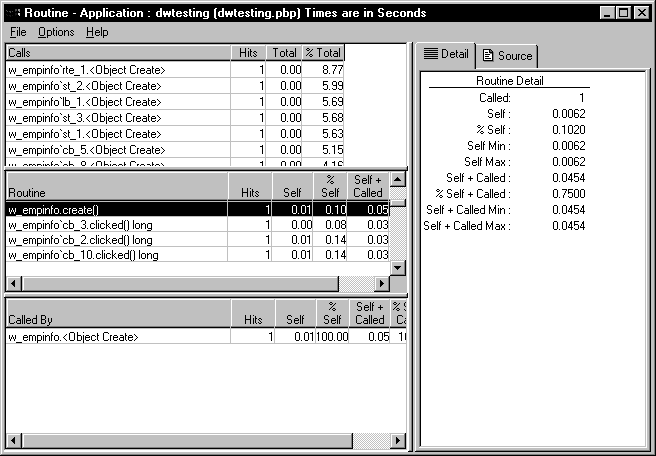
The Routine view displays statistics for a routine, its calling routines, and its called routines. It uses multiple DataWindow objects to display information for a routine:
-
Called routines
The top DataWindow lists functions and events called by the current routine.
-
Current routine
The middle DataWindow and the DataWindow on the right highlight the current routine and show detailed statistics.
-
Calling routines
The bottom DataWindow lists functions and events that call the routine displayed in the middle DataWindow.
The Routine view has two tabs:
-
Detail
Shows statistics only
-
Source
Shows statistics and source code for those routines that originated in PowerScript source
The Routine view uses the call graph model to show the call chain and cumulative statistics for routines and called routines.
You can specify the current routine by clicking in the various DataWindows.
|
To do this |
Click here |
|---|---|
|
Establish a new current routine in the current routine DataWindow |
On the routine. The profiling tool updates the top and bottom DataWindows with information on called and calling routines. |
|
Select a calling routine as the new routine |
On the routine in the top DataWindow. The profiling tool makes it the current routine in the middle DataWindow. |
|
Select a called routine as the new routine |
On the routine in the bottom DataWindow. The profiling tool makes it the current routine in the middle DataWindow. |
You can sort items by clicking the column headings.
Routine view metrics
The Routine view displays nine metrics. The profiling tool accesses these metrics from instances of the ProfileCall and ProfileRoutine objects. The time scale you specified in the Preferences dialog box determines how times are displayed.
|
Metric |
What it means |
|---|---|
|
Hits (Called on Detail tab) |
The number of times a routine executed in a particular context. |
|
Self |
The time spent in the routine or line itself. If the routine or line was executed more than once, this is the total time spent in the routine or line itself; it does not include time spent in routines called by this routine. |
|
%Self |
Self as a percentage of the total time the calling routine was active. |
|
Self Min |
The shortest time spent in the routine or line itself. If the routine or line was executed only once, this is the same as AbsoluteSelfTime. |
|
Self Max |
The longest time spent in the routine or line itself. If the routine or line was executed only once, this is the same as AbsoluteSelfTime. |
|
Self+Called |
The time spent in the routine or line and in routines or lines called from the routine or line. If the routine or line was executed more than once, this is the total time spent in the routine or line and in called routines or lines. |
|
%Self+Called |
Self+Called as a percentage of the total time that tracing was enabled. |
|
Self+Called Min |
The shortest time spent in the routine or line and in called routines or lines. If the routine or line was executed only once, this is the same as AbsoluteTotalTime. |
|
Self+Called Max |
The longest time spent in the routine or line and in called routines or lines. If the routine or line was executed only once, this is the same as AbsoluteTotalTime. |
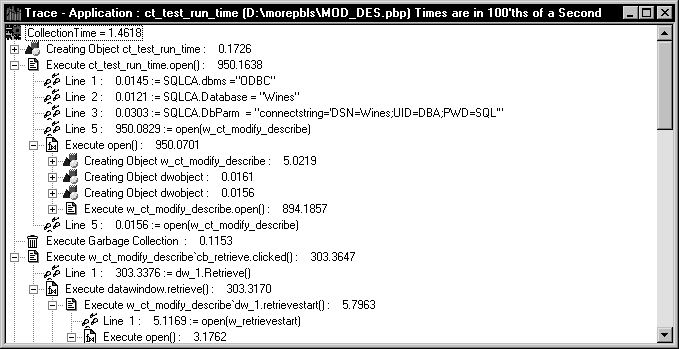
The Trace view uses a TreeView control to display the events and functions in the trace file. The initial display shows top-level routines. Each node expands to show the sequence of routine execution. The fully expanded TreeView shows the complete sequence of executed instructions for the trace file.
The Trace view uses the trace tree model to show the sequence of execution. It includes statistics and (for those routines that originated in PowerScript source) source code.
You can use the Trace View Options section of the Preferences dialog box to control the display:
-
System routines
This option controls whether the Trace view includes information for lines that execute PowerBuilder system routines.
-
Line information
This option controls whether the Trace view includes line numbers.
The following screen shows a Trace view with several nodes expanded. The number to the right of each item is the execution time for that item.
Trace view metrics
The Trace view displays two metrics. The profiling tool accesses these metrics from instances of the TraceTree and TraceTreeNode objects.
|
Entry |
What it means |
|---|---|
|
Routine or line number |
The routine or line number that was executed. |
|
Execution time |
Total execution time for the Tree view entry. This is total time from the start of the entry to the end of the entry. For example, if you call the MessageBox function, this value reflects the elapsed time from when the message box was opened until the user provided some kind of response. |
About preferences
The specifications you make in the Preferences dialog box control whether the Trace view displays system functions and line numbers.
You can control how the profiling tools display information using the Preferences dialog box. To open it, select Options>Preferences from any profiling view's menu bar.
In both Class and Routine views, you can choose how functions and events that are called more than once are displayed. Select the Aggregate Calls check box if you want the view to display a single line for each called function or event that represents a sum of all the times it was called. If you do not select the check box, the view displays statistics for each call on a separate line.
For example, if aggregation is enabled and a function calls another function five times, you see one entry with five hits; with no aggregation, you see five separate entries for the same function.
Internally, the profiling tool controls aggregation by using the AggregateDuplicateRoutineCalls boolean argument to the OutgoingCallList and IncomingCallList functions on the ProfileRoutine object.


