This section describes how to use the JDBC Driver Manager Trace tool.
You can use the JDBC Driver Manager Trace tool to trace a connection to any database that you access in InfoMaker through the JDBC interface.
Unlike the Database Trace tool, the JDBC Driver Manager Trace tool cannot trace connections through one of the native database interfaces.
What this tool does
JDBC Driver Manager Trace logs errors and informational messages originating from the Driver object currently loaded (such as SAP Sybase's jConnect JDBC driver) when InfoMaker connects to a database through the JDBC interface. It writes this information to a default log file named JDBC.LOG or to a log file that you specify. The amount of trace output varies depending on the JDBC driver being used.
What both tools do
The information from JDBC Driver Manager Trace, like Database Trace, can help you:
-
Understand what InfoMaker is doing internally while connected to a database through the JDBC interface
-
Identify and resolve problems with your JDBC connection
-
Provide useful information to Technical Support if you call them for help with your database connection
When to use this tool
Use JDBC Driver Manager Trace instead of the Database Trace tool if you want more detailed information about the JDBC driver.
Performance considerations
Turning on JDBC Driver Manager Trace can slow your performance while working in InfoMaker. Therefore, use JDBC Driver Manager Trace for debugging purposes only and keep it turned off when you are not debugging.
JDBC.LOG file
InfoMaker writes JDBC Driver Manager Trace output to a default log file named JDBC.LOG or to a log file that you specify. The default location of JDBC.LOG is a temp directory.
To start JDBC Driver Manager Trace in order to trace your JDBC connection, you must edit your database profile.
To start JDBC Driver Manager Trace, edit the database profile for the connection you want to trace, as described in the following procedure.
To start JDBC Driver Manager Trace:

Preview tab not in InfoMaker
The Preview tab is not available in the Database Profile Setup dialog box in InfoMaker.
-
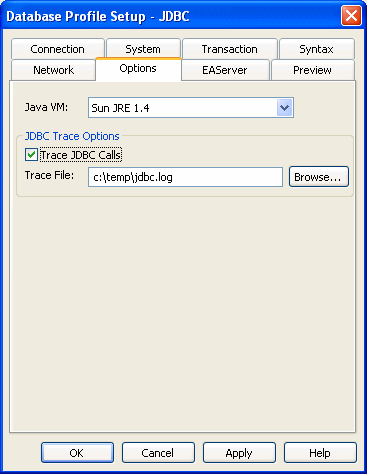
Open the Database Profile Setup - JDBC dialog box for the JDB connection you want to trace.
-
On the Options tab, select the Trace JDBC Calls check box.
-
(Optional) To specify a log file where you want InfoMaker to write the output of JDBC Driver Manager Trace, type the pathname in the Trace File box.
or
(Optional) Click Browse to display the pathname of an existing log file in the Trace File box.
By default, if the Trace JDBC Calls check box is selected and no alternative trace file is specified, InfoMaker sends JDBC Driver Manager Trace output to the default JDBC.LOG file.
-
Click OK or Apply.
The Database Profiles dialog box displays with the name of the edited profile highlighted.
InfoMaker saves your settings in the database profile entry in the registry.
For example, here are the DBMS and DBParm string values of a database profile entry for a database named Employee. The settings that start JDBC Driver Manager Trace (corresponding to the TraceFile DBParm parameter) are emphasized.
DBMS     "TRACE JDBC"
DbParm   "Driver='com.sybase.jdbc.SybDriver',
          URL='jdbc:sybase:Tds:199.93.178.151:
          5007/tsdata',JavaVM='Sun1.3',TraceFile=
           'c:\temp\jdbc.log'"
-
Click Connect in the Database Profiles dialog box to connect to the database.
or
Right-click on the connected database and select Re-connect from the dropdown menu in the Database Profiles dialog box.
InfoMaker connects to the database, starts tracing the JDBC connection, and writes output to the log file you specified.
Once you start tracing a JDBC connection with JDBC Driver Manager Trace, InfoMaker continues sending trace output to the log file until you stop tracing.
To stop JDBC Driver Manager Trace:
-
Open the Database Profile Setup - JDBC dialog box for the connection you are tracing.
For instructions, see Starting JDBC Driver Manager Trace.
-
On the Options tab, clear the Trace JDBC Calls check box.
If you supplied the pathname of a log file in the Trace File box, you can leave it specified in case you want to restart tracing later.
-
Click OK in the Database Profile Setup - JDBC dialog box.
The Database Profiles dialog box displays, with the name of the edited profile highlighted.
-
Click Connect in the Database Profiles dialog box.
or
Right click on the connected database and select Re-connect from the dropdown menu in the Database Profiles dialog box.
InfoMaker connects to the database and stops tracing the connection.
You can display the contents of the JDBC Driver Manager Trace log file anytime during an InfoMaker session.
Location of JDBC.LOG
For information about where to find the default JDBC.LOG file, see About JDBC Driver Manager Trace.
To view the contents of the log file:
-
Open JDBC.LOG or the log file you specified in one of the following ways:
-
Use the File Editor in InfoMaker. (For instructions, see the User's Guide.)
-
Use any text editor outside InfoMaker.
Leaving the log file open
If you leave the log file open as you work in InfoMaker, JDBC Driver Manager Trace does not update the log.


