Sometimes your application does not behave the way you think it will. Perhaps a variable is not being assigned the value you expect, or a script does not do what you want it to. In these situations, you can closely examine your application by running it in debug mode.
In debug mode, you can set breakpoints (stops) in scripts and functions, step through the code line by line, and display the contents of variables to locate logic errors and mistakes that result in errors during execution. When you run your application in debug mode, PowerBuilder suspends execution just before it hits a line containing a breakpoint. You can then look at and correct the values of variables.
In this lesson you:
How long does it take?
About 20 minutes.
Where you are
> Add breakpoints in application scripts
Set a watch and a conditional breakpoint
Now you open the Debugger and add breakpoints to examine the behavior of the login and Customer windows. When PowerBuilder runs the application in debug mode, it stops just before executing a line containing a breakpoint.
When you insert breakpoints in a script, you should select lines that contain executable statements. If you try to set a breakpoint in variable-declaration lines, comment lines, or blank lines, PowerBuilder sets the breakpoint at the next executable line.
-
Click the Debug button (
 ) in the PowerBar.
PowerBuilder opens the Debugger. There are three stacks of tabbed panes in the default view layout scheme. The Source view is visible in a single pane at the top left of the Debug window. The Source Browser view is open in the pane at the top right.
If the Debug window looks different
If you have opened the Debug window before and opened, moved, or closed any views, your display may look different. To restore the default view layout scheme, select View>Layouts>Default from the menu bar.
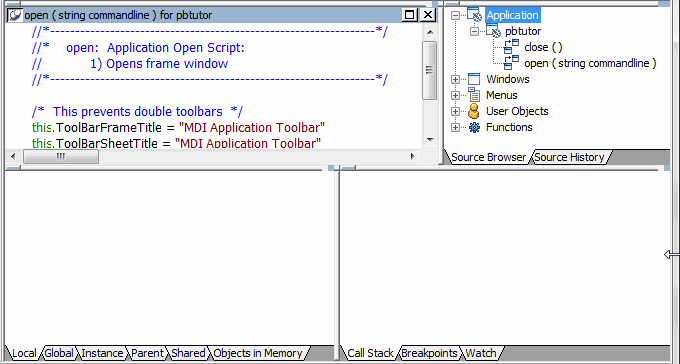
The source code for the application Open event displays in the Source view at top left. If it does not display, expand the Application node in the Source Browser view's tree view and double-click the Open event under the pbtutor application.
-
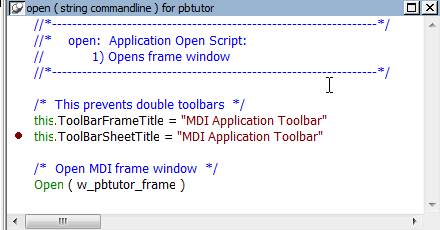
In the Source view, double-click the line containing the following assignment statement:
this.ToolBarSheetTitle = "MDI Application Toolbar"
A black breakpoint symbol displays at the start of the line to show that a breakpoint has been set on the statement.
-
Expand the following node in the Source Browser view: Windows>w_welcome>cb_ok
The Source Browser view lists only events that have been coded. The only event for the login window OK button is the Clicked event.
-
Double-click the Clicked event for the cb_ok button in the Source Browser view.
The code for the Clicked event displays in the Source view.
-
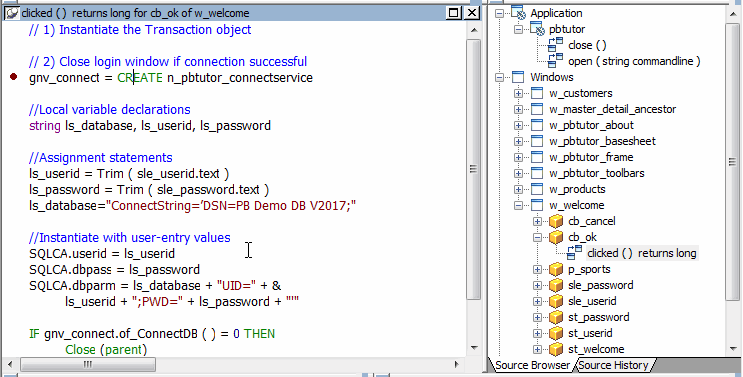
Double-click the following line:
gnv_connect = CREATE &
         n_pbtutor_connectservice
A breakpoint symbol displays at the start of the line.
-
Double-click w_master_detail_ancestor in the Source Browser view.
-
Double-click dw_master, then rowfocuschanged.
PowerBuilder displays the script for the RowFocusChanged event of the dw_master DataWindow control in the Source view.
-
Double-click this line:
IF dw_detail.Retrieve(ll_itemnum) = -1 THEN
A breakpoint symbol displays at the start of the line.
-
Select the Breakpoints tab in the lower-right stack.
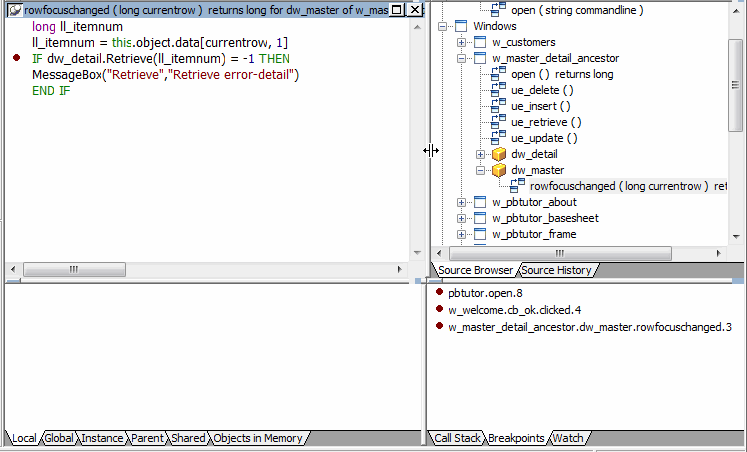
You should see the breakpoints you set in the Breakpoints view. To complete this lesson, you need to have these breakpoints set correctly.
If you have additional breakpoints
You can clear any excess breakpoints using the pop-up menu in the Breakpoints view.
Where you are
Add breakpoints in application scripts
Set a watch and a conditional breakpoint
Now you run the application in debug mode. You step through the code line by line.
About the Step buttons
You can use either Step In or Step Over to step through an application one statement at a time. They have the same result except when the next statement contains a call to a function.
Use Step Over to execute the function as a single statement. Use Step In if you want to step into a function and examine the effects of each statement in the function.
If you have stepped into a function, you can use Step Out to execute the rest of the function as a single step and return to the next statement in the script that called the function.
-
Click the Start button (
 ) in PainterBar1
or
Select Debug>Start pbtutor from the menu bar.
The application starts and runs until it hits a breakpoint (in this case, the call to the assignment statement for the toolbar title for sheet windows).
You return to the Debug window, with the line containing the breakpoint displayed. The yellow arrow cursor means that this line contains the next statement to be executed.
-
Click the Global tab in the lower-left stack.
The Global Variables view displays.
-
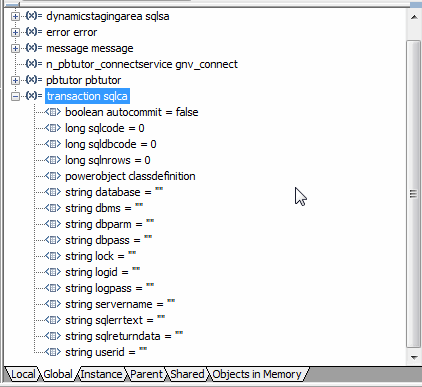
Double-click transaction sqlca.
Find the DBMS property, which has a String datatype.
Notice that this property does not yet have a value associated with it because the Debugger interrupted execution before the ProfileString function executed.
-
To execute the next statement, click the Step In button (
 ) in PainterBar1
or
Select Debug>Step In from the menu bar.
The application starts execution of the Open event for the MDI frame window.
-
Use Step In or Step Over to step through the code until you reach this statement in the script for the frame window Open event:
open(w_welcome)
After PowerBuilder finishes executing this statement, the login window displays and the Debug window is minimized.
The Open event for the frame window also has a posted call to the ue_postopen function (that you stepped through without examining). This function in turn includes code that starts the processing of a chain of sheet manager functions. These functions are processed at the end of the script for the Open event, after the login window displays.
-
Click Step Over (
 ) until the login window displays and the
Debugger is minimized.
Type dba in the User ID box of the login window.
Type sql in the Password box and click OK.
You return to the Debug window. The yellow arrow in the Source view points to the next executable statement, the CREATE statement for the connection service object. This is the first executable line in the script for the Clicked event of the cb_ok command button.
-
Select the Call Stack tab in the lower-right stack.
The yellow arrow in the Call Stack view indicates the current location in the call stack. If you double-click another line in the stack, the Source and Variables views change to display the context of that line, and a green arrow indicates the line in the Source view. If you then single-click another line in the stack, a green arrow displays in the Call Stack view to indicate the line for which context is displayed. When you continue to step through the code, the Source and Variables views return to the current context.
-
Click the Step In button.
The Debugger takes you to the script for the Constructor event of the connection service object.
-
Click the Step Out button (
 ).
).
-
Click the Global tab in the lower-left stack.
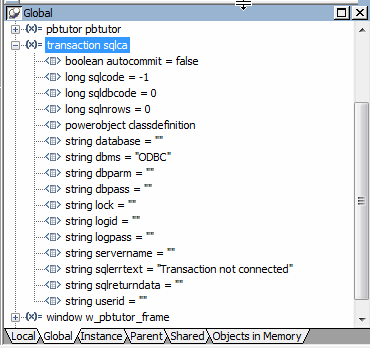
Look again at the Transaction object properties.
You step out of the Constructor event in a single step and return to the script for the OK button Clicked event. Now the value of sqlcode has changed, and the sqlerrortext and DBMS property have values, but the UserID, DBPass, and DBParm properties do not.
The values were assigned during execution of the Constructor event of the connection service object after the of_GetConnectionInfo function returned information from the INI file, but because you commented out the lines in the code for the UserID, DBPass, and DBParm properties, these values were not retrieved.
-
Click on the Local tab in the lower-left stack.
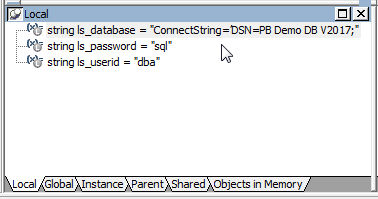
The local variables for the Clicked script have not yet been assigned values.
-
Use the Step In button to step through the three assignment statements for the local variables.
As you step through each statement, you can check that the values assigned to the local variables are what you expected.
-
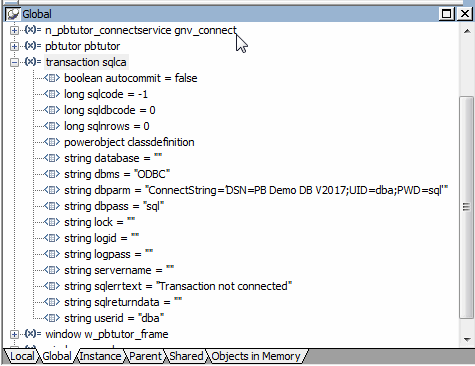
Click again on the Global tab in the lower-left stack and expand the Transaction object.
Use the Step In button to step through the three lines that instantiate the Transaction object (SQLCA) with user-entry values for UserID, DBPass, and DBParm.
As you step through each statement, you can check that the values you entered in the login window are being assigned to the Transaction object. You are still not connected to the database until the connection service object of_Connect function is executed.
-
Click the Continue button (
 ) in PainterBar1.
-
The Continue button resumes execution until the next breakpoint. The database connection is established, the login window closes, and the MDI frame for your application displays. The application is waiting for user input.
-
Select File>Report>Maintain Customers from the menu bar.
The application continues until it reaches the line in the RowFocusChanged event that contains the next breakpoint you added.
The RowFocusChanged event for a DataWindow occurs before the DataWindow is displayed. For this reason, execution stops before the Customer window is opened.
Where you are
Add breakpoints in application scripts
> Set a watch and a conditional breakpoint
Next you set a watch on a variable whose value changes when the user selects a row in the Customer window. You then change one of the simple breakpoints you have set into a conditional breakpoint that is triggered only when a variable has a specific value.
-
Click the Watch tab in the lower-right stack.
Click the Local tab in the lower-left stack.
Select the ll_itemnum variable in the Local view and drag it to the Watch view.
The ll_itemnum variable is set to 101, the ID of the first customer retrieved. Displaying it in the Watch view makes it easier to observe when its value changes. You can also drag Global, Instance, and Parent variables to the Watch view so that you can easily keep track of several variables of different types.
-
Click the Continue button (
 ).
).
The application resumes execution. The Customer window displays and shows the list of customers retrieved from the database. The detail DataWindow shows information about customer 101.
-
Select a different row in the master DataWindow of the Customer window.
You return to the Debug window. The new value of ll_itemnum displays in both the Local Variables view and the Watch view.
-
Click the Breakpoints tab in the lower-right stack.
Double-click the rowfocuschanged breakpoint.
The Edit Breakpoints dialog box opens with the breakpoint in the RowFocusChanged event selected.
-
Type the following line in the Condition text box and click OK:
ll_itemnum = 107
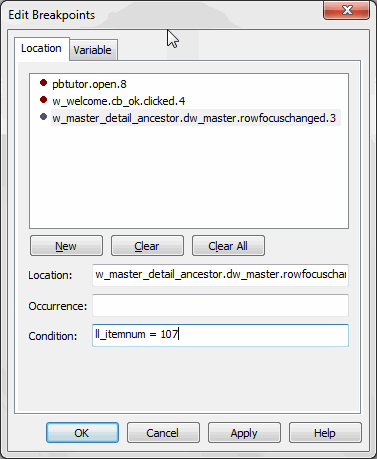
The breakpoint in the RowFocusChanged event script is now a conditional breakpoint. PowerBuilder suspends execution only when it reaches this statement and the value of ll_itemnum is 107.
-
Click OK to close the dialog box.
Click the Continue button.
The application resumes execution. Now you can select different rows in the Customer window, and the Debug window opens at the breakpoint only if you select the customer whose ID is 107.
If you select customer 107, click the Continue button again to return to the application.
-
Select File>Exit from the application's menu bar.
The application terminates and you return to the Debug window.
-
Select File>Close from the menu bar.
You return to the PowerBuilder development environment.


