Where you are
Add breakpoints in application scripts
Set a watch and a conditional breakpoint
Now you run the application in debug mode. You step through the code line by line.
About the Step buttons
You can use either Step In or Step Over to step through an application one statement at a time. They have the same result except when the next statement contains a call to a function.
Use Step Over to execute the function as a single statement. Use Step In if you want to step into a function and examine the effects of each statement in the function.
If you have stepped into a function, you can use Step Out to execute the rest of the function as a single step and return to the next statement in the script that called the function.
-
Click the Start button (
 ) in PainterBar1
or
Select Debug>Start pbtutor from the menu bar.
The application starts and runs until it hits a breakpoint (in this case, the call to the assignment statement for the toolbar title for sheet windows).
You return to the Debug window, with the line containing the breakpoint displayed. The yellow arrow cursor means that this line contains the next statement to be executed.
-
Click the Global tab in the lower-left stack.
The Global Variables view displays.
-
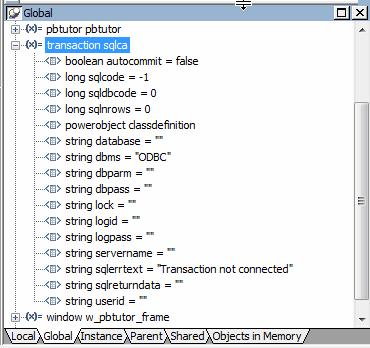
Double-click transaction sqlca.
Find the DBMS property, which has a String datatype.
Notice that this property does not yet have a value associated with it because the Debugger interrupted execution before the ProfileString function executed.

-
To execute the next statement, click the Step In button (
 ) in PainterBar1
or
Select Debug>Step In from the menu bar.
The application starts execution of the Open event for the MDI frame window.
-
Use Step In or Step Over to step through the code until you reach this statement in the script for the frame window Open event:
open(w_welcome)
After PowerBuilder finishes executing this statement, the login window displays and the Debug window is minimized.
The Open event for the frame window also has a posted call to the ue_postopen function (that you stepped through without examining). This function in turn includes code that starts the processing of a chain of sheet manager functions. These functions are processed at the end of the script for the Open event, after the login window displays.
-
Click Step Over (
 ) until the login window displays and the
Debugger is minimized.
Type dba in the User ID box of the login window.
Type sql in the Password box and click OK.
You return to the Debug window. The yellow arrow in the Source view points to the next executable statement, the CREATE statement for the connection service object. This is the first executable line in the script for the Clicked event of the cb_ok command button.
-
Select the Call Stack tab in the lower-right stack.
The yellow arrow in the Call Stack view indicates the current location in the call stack. If you double-click another line in the stack, the Source and Variables views change to display the context of that line, and a green arrow indicates the line in the Source view. If you then single-click another line in the stack, a green arrow displays in the Call Stack view to indicate the line for which context is displayed. When you continue to step through the code, the Source and Variables views return to the current context.
-
Click the Step In button.
The Debugger takes you to the script for the Constructor event of the connection service object.
-
Click the Step Out button (
 ).
).
-
Click the Global tab in the lower-left stack.
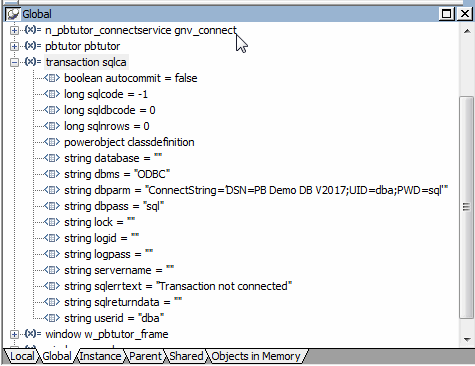
Look again at the Transaction object properties.
You step out of the Constructor event in a single step and return to the script for the OK button Clicked event. Now the value of sqlcode has changed, and the sqlerrortext and DBMS property have values, but the UserID, DBPass, and DBParm properties do not.
The values were assigned during execution of the Constructor event of the connection service object after the of_GetConnectionInfo function returned information from the INI file, but because you commented out the lines in the code for the UserID, DBPass, and DBParm properties, these values were not retrieved.

-
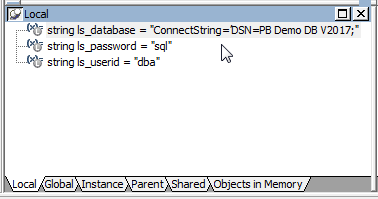
Click on the Local tab in the lower-left stack.
The local variables for the Clicked script have not yet been assigned values.
-
Use the Step In button to step through the three assignment statements for the local variables.
As you step through each statement, you can check that the values assigned to the local variables are what you expected.

-
Click again on the Global tab in the lower-left stack and expand the Transaction object.
Use the Step In button to step through the three lines that instantiate the Transaction object (SQLCA) with user-entry values for UserID, DBPass, and DBParm.
As you step through each statement, you can check that the values you entered in the login window are being assigned to the Transaction object. You are still not connected to the database until the connection service object of_Connect function is executed.

-
Click the Continue button (
 ) in PainterBar1.
-
The Continue button resumes execution until the next breakpoint. The database connection is established, the login window closes, and the MDI frame for your application displays. The application is waiting for user input.
-
Select File>Report>Maintain Customers from the menu bar.
The application continues until it reaches the line in the RowFocusChanged event that contains the next breakpoint you added.
The RowFocusChanged event for a DataWindow occurs before the DataWindow is displayed. For this reason, execution stops before the Customer window is opened.


