Where you are
> Open the report to contain the graph
First you open a report that has been created for you. This report provides the data for your graph.
-
Click the Open button in the PowerBar.

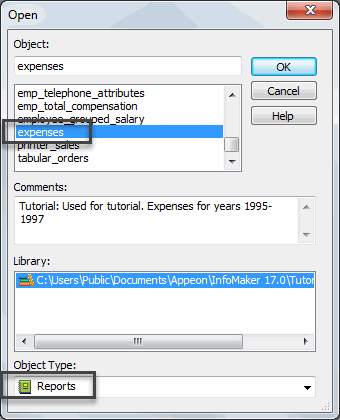
The Open dialog box displays. It lists objects in the current library (tutor_im). You will be using the report named expenses.
-
Select the Reports object type at the bottom of the dialog box.
Click expenses (scroll the list).
Click OK.

The report displays in the Report painter. Here is the Design view.

-
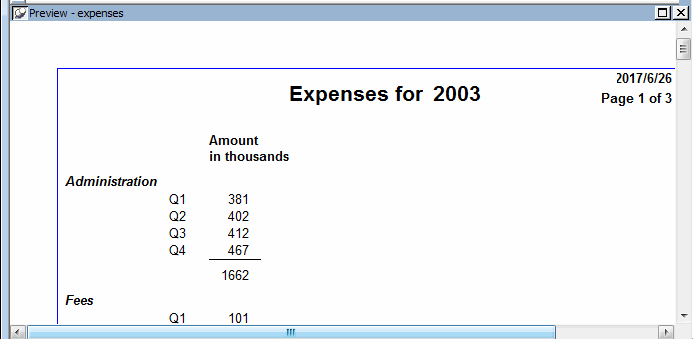
Look at the Preview view.
InfoMaker retrieves information from the database and displays as much as fits on the screen.

-
Use the scroll bar on the right edge of the report to see more data.
The entire report consists of three pages: one for 2003, one for 2004, and one for 2005.


