The query you create retrieves financial data. When you have finished, the query returns data from the database that is similar to this.
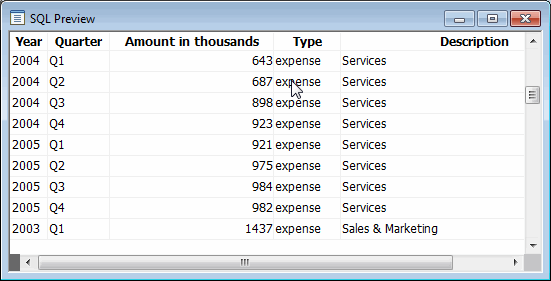
The financial data is stored in two tables: the fin_data and fin_code tables.
The following illustration shows the two tables with some data. The code value in the fin_data table gets its meaning from the fin_code table.
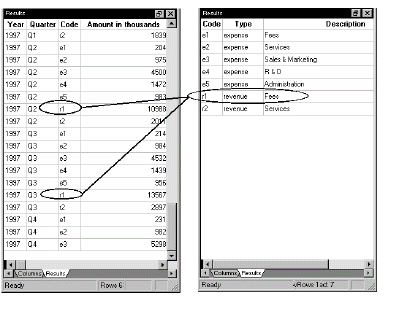
For example, the r1 circled in the fin_data table means the row reports a revenue amount for fees.
Where you are
Specify row selection criteria
Create a report using the query
-
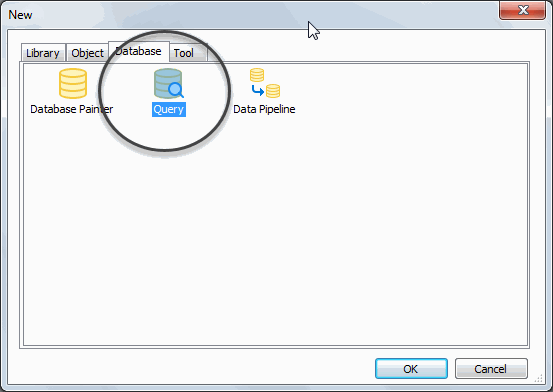
Click the New button in the PowerBar.

The New dialog box displays.
-
Select the Database tab and the Query icon.
Click OK.
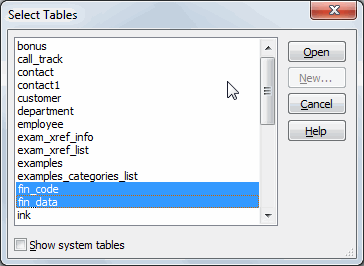
The Select Tables dialog box displays. In this dialog box you can select one or more tables to use.
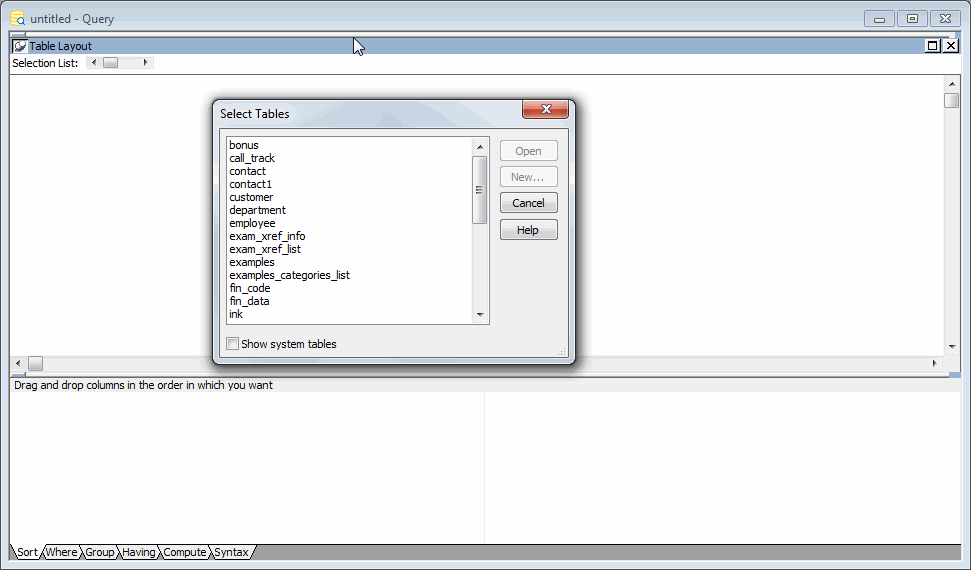
You are going to use two of the tables.
-
Click the tables named fin_code and fin_data.
-
Click Open.
The fin_code and fin_data tables display. Both tables have a code column. The tables are joined on the code column.
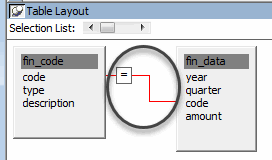
The fin_data table has a code value in each row to indicate what the row of data applies to (for example, r1 means revenue from fees).
The fin_code table stores information about codes, including the actual values (such as r1 and e4), the type of each code (revenue or expense), and a description of each code.
Next you select columns from the tables.
-
Click year in the fin_data table.
Click quarter in the fin_data table.
Click amount in the fin_data table.
Click type in the fin_code table.
Click description in the fin_code table.
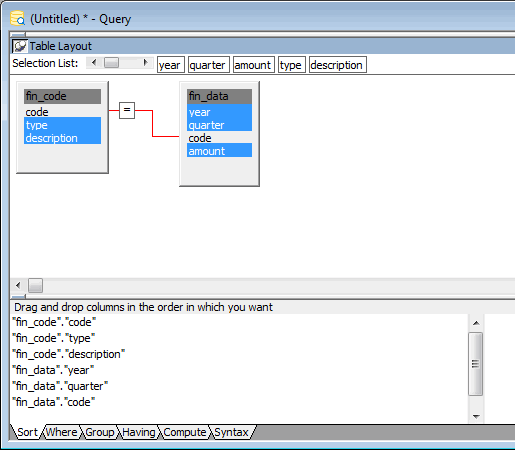
When you click each column, it is highlighted in the table and added to the selection list above the tables.
-
Select Design>Preview from the menu bar.
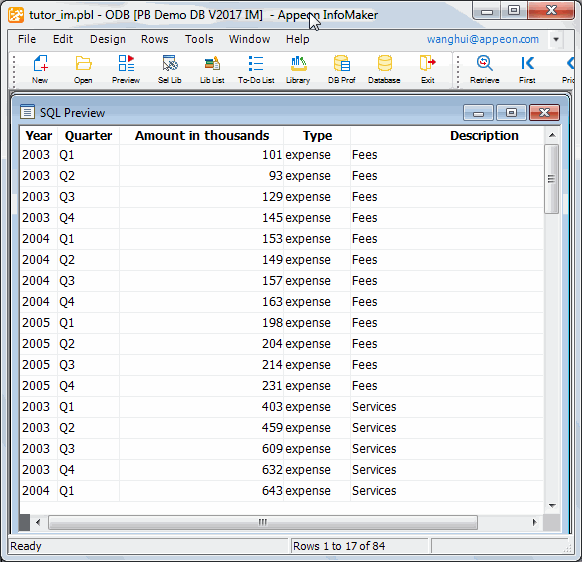
You can see the results of your query. InfoMaker uses your query as it is currently defined to access the database and retrieve data.
-
Use the scroll bar to view the data.
Each row has either the word expense or the word revenue in the Type column. First you save the query and then you use the value in the Type column to select rows for the query.
-
Select File>Close from the menu bar.
You return to the workspace.
Where you are
Specify row selection criteria
Create a report using the query
Now you save the query and give it a name.
-
Make sure you are back in the workspace.
Select File>Save from the menu bar.
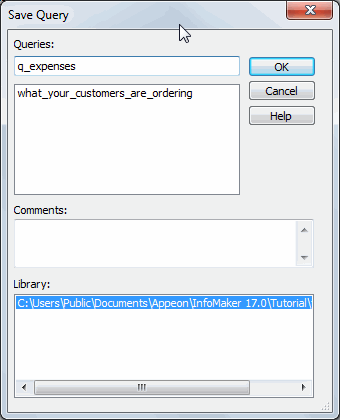
The Save Query dialog box displays with the pointer positioned for you to type a name for the query.
-
Type q_expenses.
-
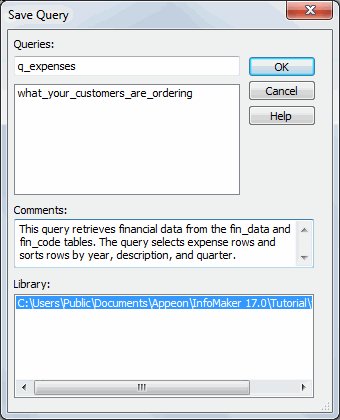
Click in the Comments box and type This query retrieves financial data from the fin_data and fin_code tables. The query selects expense rows and sorts rows by year, description, and quarter.
-
Press Enter.
InfoMaker saves your query.
Where you are
> Specify row selection criteria
Create a report using the query
Now you select the rows to include in the query. To do this you specify selection criteria.
The query you are creating is for expenses, so the rows you need are those whose type is expense. You do not need the rows whose type is revenue.
-
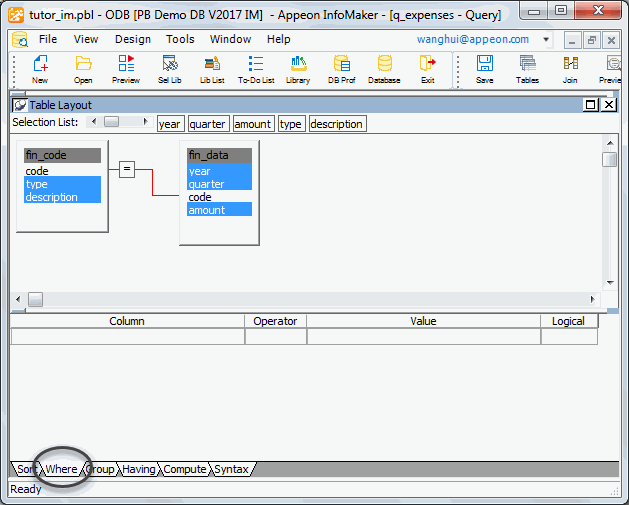
Click the Where tab at the bottom of the workspace if it is not in front.
The Where tab comes to the front. In the Where tab you specify selection criteria for retrieving rows.
-
Click the first space under Column and then click the arrow to display a list of columns.
Click the column named "fin_code"."type" in the list of columns.


The equal sign (=) displays by default in the Operator box. This is what you want.
-
Move the pointer over the Value box.
Press the right mouse button to display the pop-up menu.
Select Value.
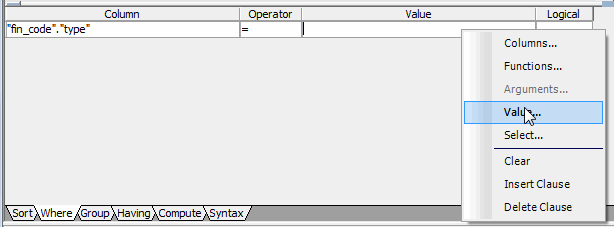
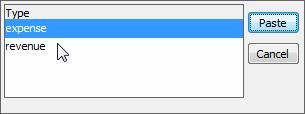
When you select Value, InfoMaker lists the values in the "fin_code"."type" column, which are expense and revenue.
-
Select expense and click the Paste button.
The selection criteria are complete. Notice that the value expense is surrounded with single quotes. These are required. If you type the value here rather than choosing it, you need to type the single quotes.
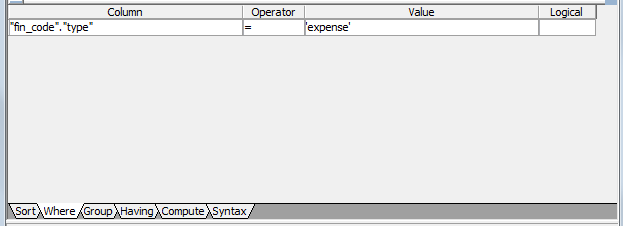
Notice that the Logical box displays at the end of the line. This box is for choosing a logical connector such as AND so that you can specify more than one selection requirement. You do not need to use this box for this query.
-
Select Design>Preview from the menu bar.
Use the scroll bar to view the data.
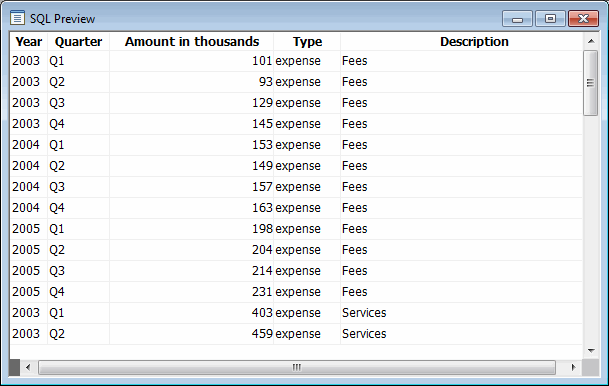
Now all rows have expense in the Type column. Rows with revenue in the Type column are not retrieved.
-
Select File>Close from the menu bar.
You return to the workspace.
Where you are
Specify row selection criteria
> Specify sorting for the rows
Create a report using the query
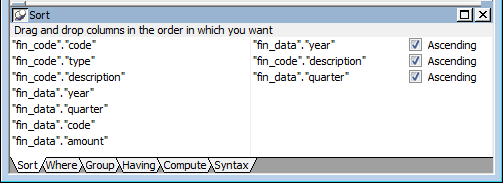
Now you specify sorting for the rows. When you specify sorting, you also enable grouping. Before you can define a group, the rows have to be sorted so that the data can be grouped.
-
Click the Sort tab at the bottom of the workspace.
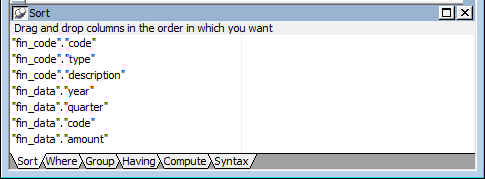
The Sort tab comes to the front. In the Sort tab, you specify one or more columns to use for sorting the rows.
-
Scroll the list as needed to drag and drop column names.
Drag and drop "fin_data"."year" from the left box to the right box.
Drag and drop "fin_code"."description" from the left box to the right box.
Drag and drop "fin_data"."quarter" from the left box to the right box.
In all cases Ascending is what you want. Ascending means years and quarters are ordered by increasing values and descriptions are alphabetized from A to Z.
-
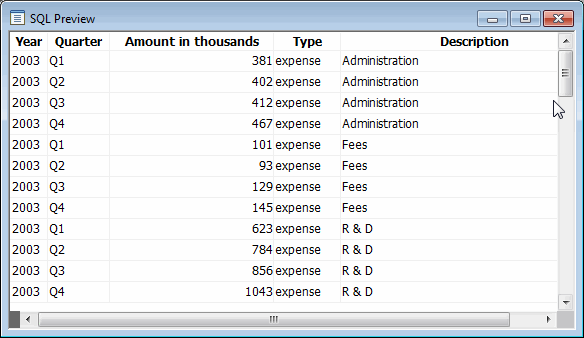
Select Design>Preview from the menu bar.
Use the scroll bar to view the data.
First the rows are sorted by year. All the 2003 information is first. Then they are sorted by description so that expenses of the same category are together. Finally the rows are sorted by quarter so that the data is always time-sequenced.
-
Select File>Close from the menu bar.
You return to the workspace.
-
Select File>Close from the menu bar.
If prompted to save changes, click Yes.
The Query painter closes.
Where you are
Specify row selection criteria
> Create a report using the query
Now you use the query to create a new report.
-
Click the New button in the PowerBar.
Select the Object tab.
Select the Tabular presentation style.
Click OK.
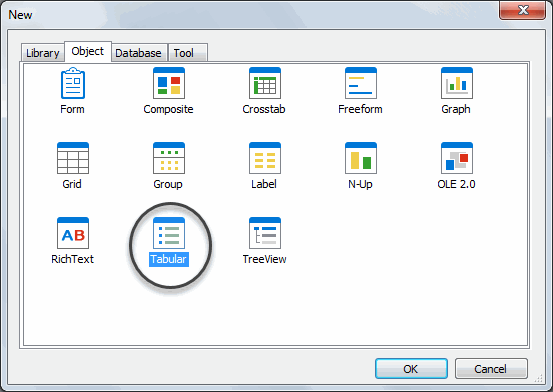
The wizard for creating tabular reports displays.
-
Select the Query data source.
Make sure the Retrieve on Preview check box is selected and click Next.
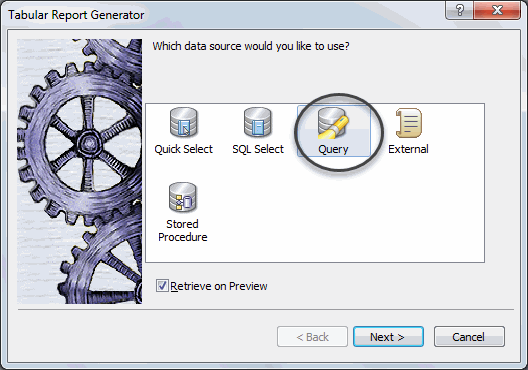
The Select Query dialog box displays. In this dialog box you specify the query to use. You are going to use the query you just created as the data source.
-
Click the button to the right of the Specify Query box.
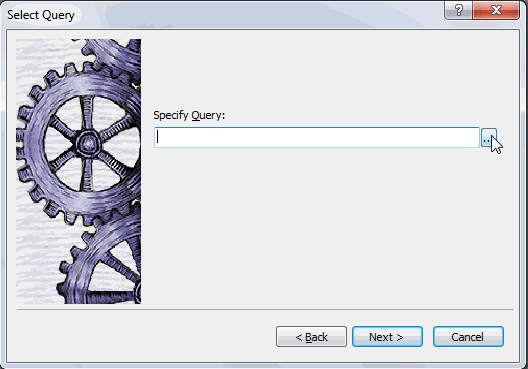
The Open dialog box displays.
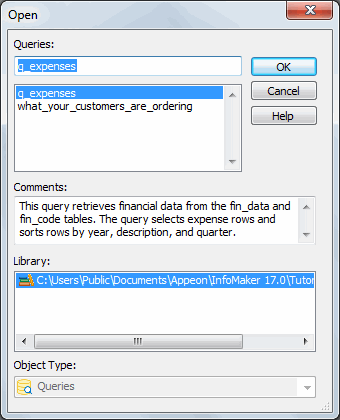
-
Click q_expenses and click OK.
The query q_expenses displays in the Specify Query box.
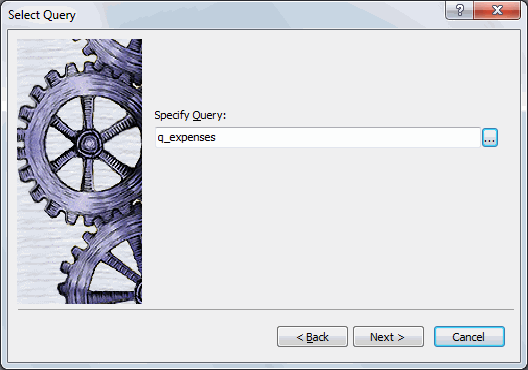
-
Click Next.
The Select Color and Border Setting dialog box displays. You are going to accept the defaults.
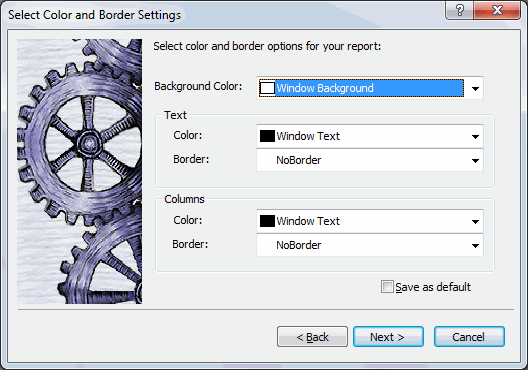
-
Click Next.
A dialog box summarizing all your specifications displays.
-
Look over your specifications and then click Finish.
Your report displays in the Report painter. This is the Design view.
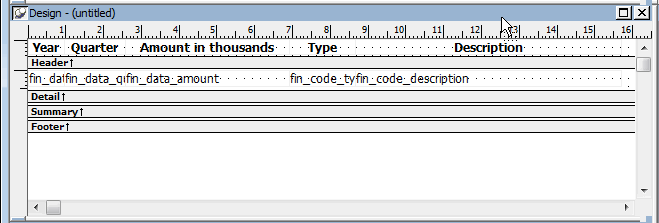
InfoMaker uses the query you created to retrieve data from the database. Because the query includes selection criteria and sorting requirements, the database returns only the data you selected, in the sort order you specified. Here is the report in the Preview view.
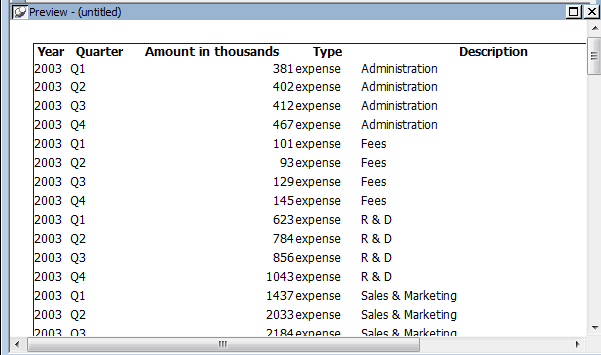
At this point you could continue designing and improving your report, but for this tutorial, you leave the Report painter now. You do not save the report.
-
Select File>Close from the menu bar.
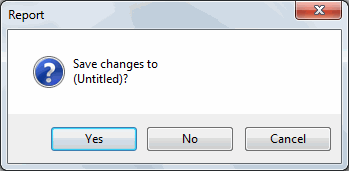
This Message Box displays to see if you want to save your report.
-
Click No.
The Report painter closes.


