Chapter 5. Debugging Your Code
Debugging is a technique that consists of stepping through an application's code execution to analyze and understand its data and behavior and thus track down and correct errors and bugs.
SnapDevelop comes with some comprehensive and robust debugging facilities that enable the user to debug desktop applications, Web APIs and even Docker containers and Kubernetes deployments.
By reading this article you'll become familiar with SnapDevelop's debugging facilities and how to use them to track down bugs in your applications.
Creating the project
You'll begin by creating a Web API project from a template so that only minimal changes to the code are necessary.
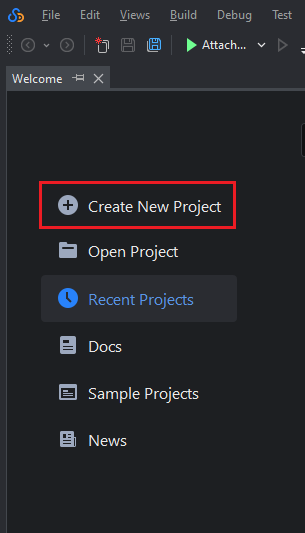
In the Welcome screen click the Create New Project button.
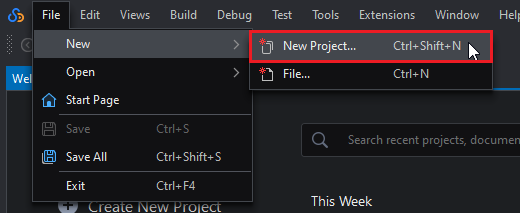
Alternatively, you can create a new project with the File menu by going File > New > New Project...
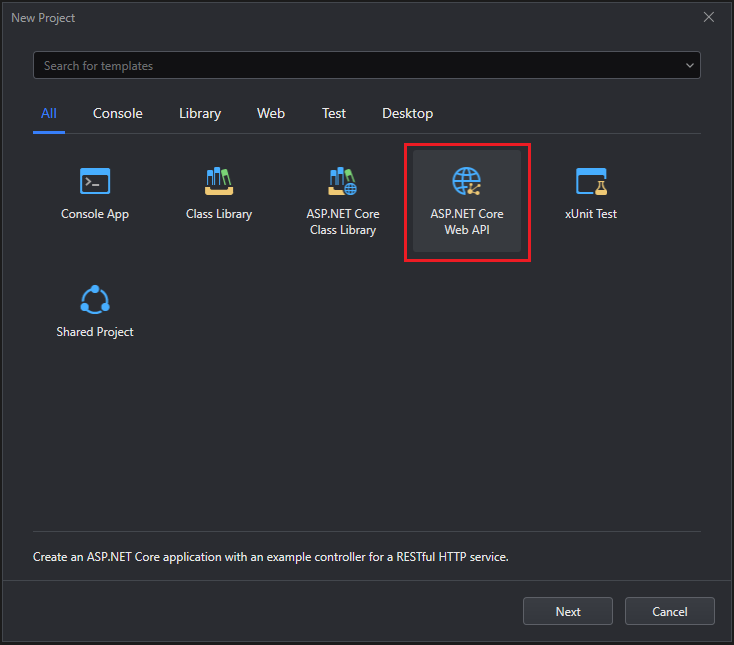
Select ASP.NET Core Web API and click Next.
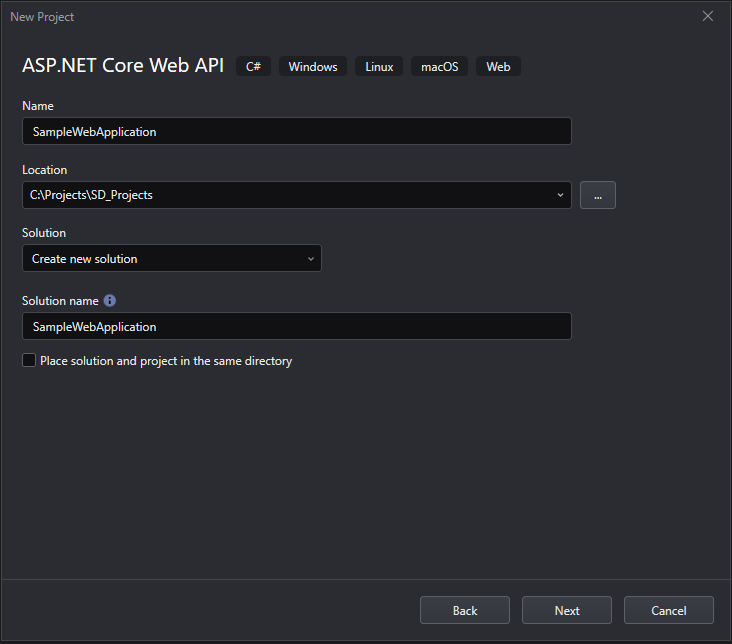
Introduce a name and select the location for the project, then click Next.
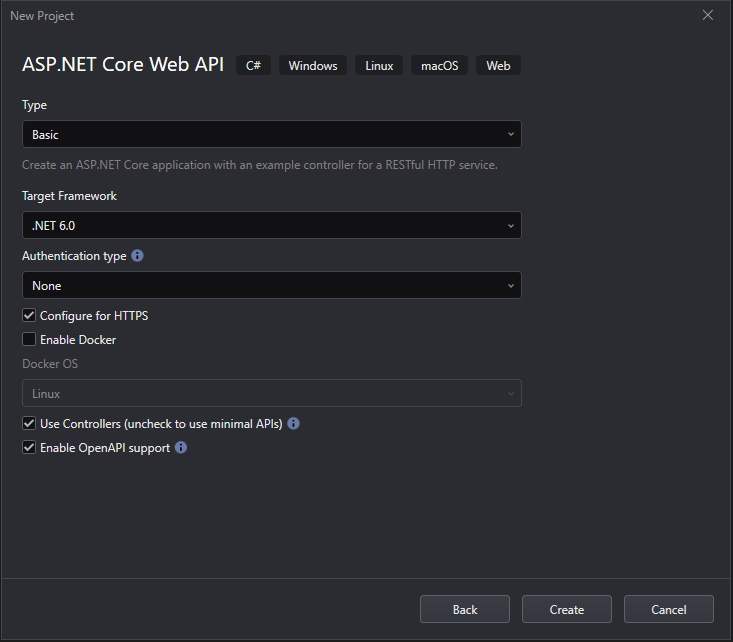
Leave the project settings as they are and click Create.
For detailed information about these project settings, refer to Scaffolding a Web API project.
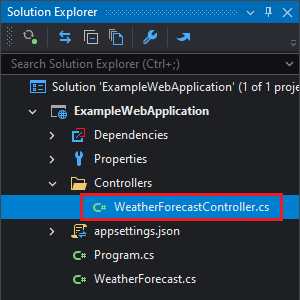
Open the ExampleWebApplication > Controllers > WeatherForecastController.cs file by browsing the Solution explorer.
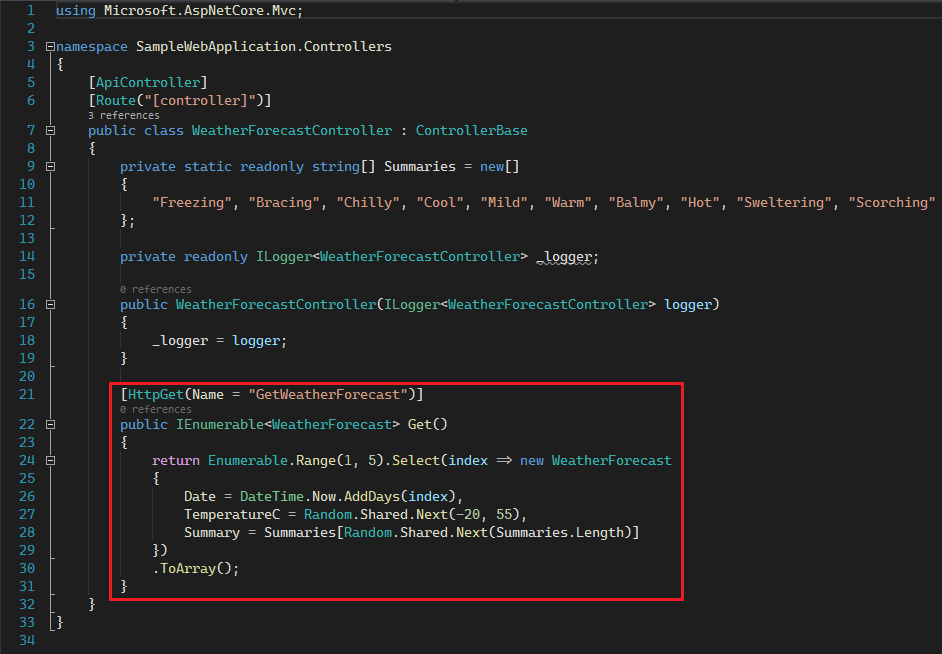
Replace this section of codes
with the following codes:
[HttpGet]
public IEnumerable<WeatherForecast> Get()
{
    return GetRange(5).ToArray();
}

private IEnumerable<WeatherForecast> GetRange(int count)
{
    return Enumerable.Range(1, count).Select(index =>
    {
        var value = new WeatherForecast
        {
            Date = DateTime.Now.AddDays(index),
            TemperatureC = Random.Shared.Next(-20, 55),
            Summary = Summaries[Random.Shared.Next(Summaries.Length)]
        };
        return value;
    }
    );
}
Adding a Breakpoint
A Breakpoint is an indication to the debugger where to pause the execution of the code and allow you to inspect and control the execution of the program.
Go to the WeatherForecastController.cs file and place your cursor on line 30 (the line with the var value = ... statement). There are 3 ways of adding/deleting breakpoints:
Context menu -- Right click on the line in the editor and go to Breakpoint > Insert Breakpoint...
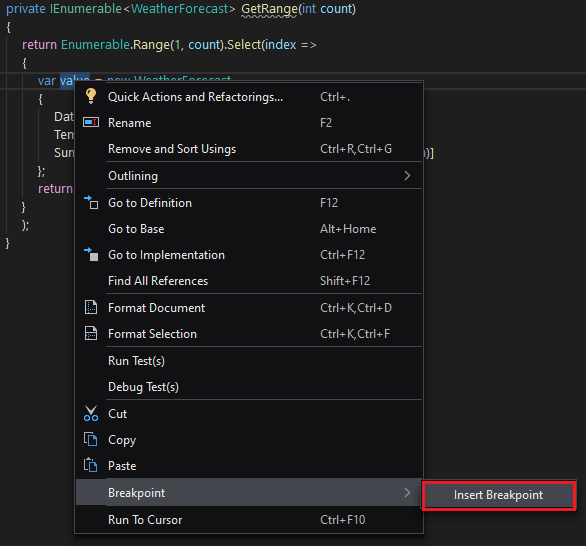
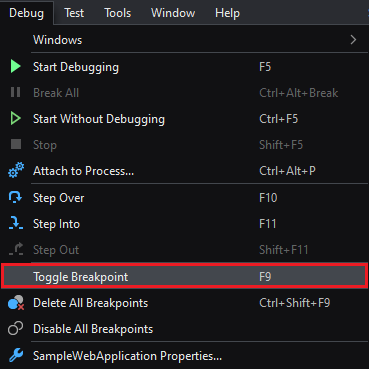
Debug menu -- Place your cursor on the line you want to add the breakpoint to and then go to Debug > Toggle Breakpoint:
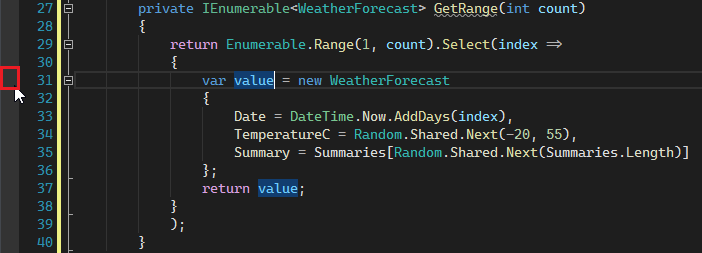
Breakpoint indicator -- On the line you want to set the breakpoint on, click the gray bar on the left of the line number indicator:
Toggle Breakpoint Shortcut
Place the cursor on the line you want to set the breakpoint on and press the F9 key.
You can follow the same steps to remove a breakpoint from a line.
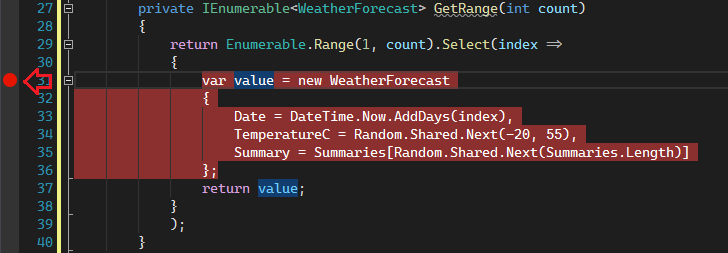
When a line has a breakpoint on it, it will show on the breakpoint column in the editor and the text background will turn red:
Debugging the project
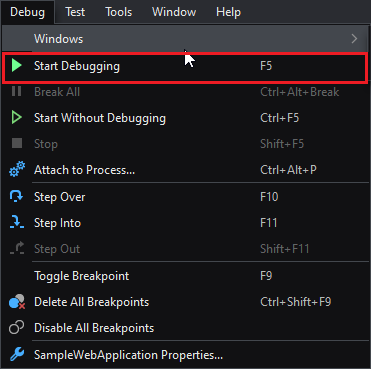
To begin debugging a project, you can use the Debug > Start Debugging button.
Or you can use the button on the toolbar. This button's name will change depending on your debug settings.

Start debugging the application by following either of the methods previously mentioned.
A console window will open. When this window shows the text Now listening on: <api_url>, open a web browser and navigate to the URL http://<api_url>/weatherforecast.
The application will start, but the page will not load because the breakpoint has been hit and execution paused. SnapDevelop will light up.
Using the Debugger
When you start debugging an application, SnapDevelop's UI changes to Debug Mode. When a breakpoint is hit, the debugger pauses and a lot more information about the current execution context is accessible through several views.
Editor
Current line indicator
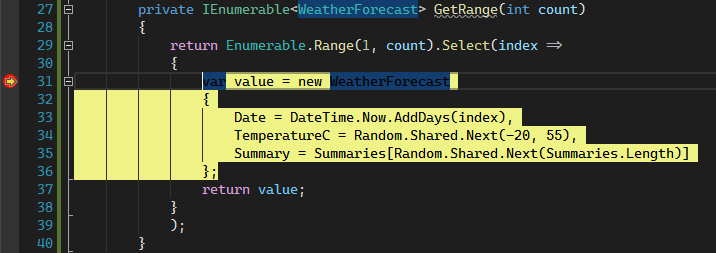
The editor will show with a yellow arrow on the Breakpoint Indicator and yellow text background the line that's going to be executed next.
Data Tips
When the debugger hits a breakpoint and execution is under your control, you become able to inspect the values of the variables in the current context by hovering over a variable or parameter.
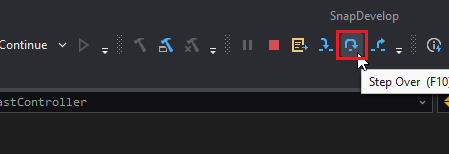
Click the Step Over button on the toolbar to have the program execute the current line and move to the next. The Step Over button will be explained with more detail in a later section.
Hover over the value variable to reveal a Data Tip:
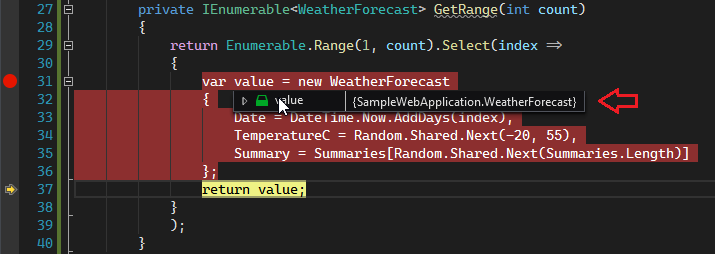
The data tip shows the element's identifier and its runtime type. When the element is a complex type, it can be expanded by clicking on or hovering over the triangle on the left.
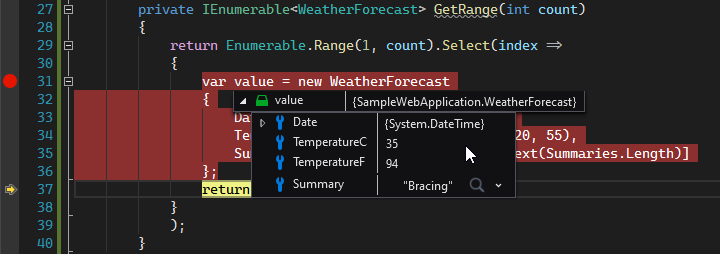
This can be repeated for as long as there are complex types to expand.
For string-type variable values, you can also click the magnifying glass icon behind the variable value and choose to view the variable value in the JSON format or text format.
Menu
The Debug menu shows the following entries when a breakpoint has been hit:
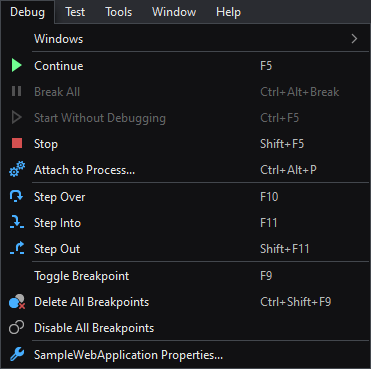
| Menu Entry | Description |
|---|---|
| Windows | Shows a list of windows that can be shown to perform different debugging tasks. These windows will be described in further detail in a later section. |
| Continue | Continues with the execution until the next breakpoint (or exception). |
| Break All | (When not navigating through the code) stops the execution of the code and will try to open the corresponding source code file on which it broke the execution. |
| Start Without Debugging | Starts the current project without attaching the debugger |
| Stop | Terminates the debugging session and closes the application. |
| Attach to Process | Try to attach the debugger to an already-running process. This will only work if such a process has loadable debug information. |
| Step Over | Executes the current statement but doesn't go inside it if it's a function. |
| Step Into | Executes the current statement and goes inside it if it's a function (and its debug information is available). |
| Step Out | Return to the caller of the current function, executing the rest of the code in the current scope. |
| Toggle Breakpoint | Toggles the breakpoint in the current line. |
| Delete All Breakpoints | Deletes all breakpoints (can't be undone). |
| Disable All Breakpoints | Disables all breakpoints (can be undone). Disabled breakpoints will not be hit. |
| <Project Name> Properties | Opens the debug properties for the current project. |
For reference, the following is the Debug menu when not in debug mode:
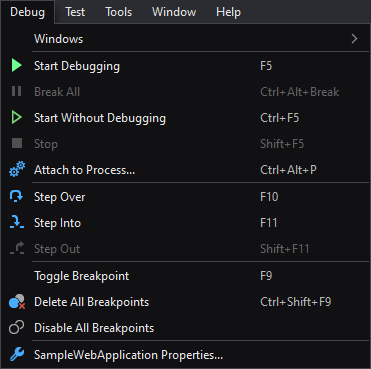
The only different entry is Start Debugging.
| Menu Entry | Description |
|---|---|
| Start Debugging | Starts debugging the current project |
Toolbar
The debugging interface has a toolbar that helps to quickly start/stop debugging and navigating through the code.

| Button | Description |
|---|---|
| Break All | Pauses the application execution and tries to open the file that's being currently executed. |
| Stop | Terminates the debugging session and closes the application. |
| Show Next Statement | Shows the statement that will be executed next. |
| Step In | Executes the current statement and goes inside it if it's a function (and its debug information is available). |
| Step Over | Executes the current statement but doesn't go inside it if it's a function. |
| Step Out | Returns to the caller of the current function, executing the rest of the code in the current scope. |
| Process | Shows the debugged processes in a drop-down list. When multiple projects have the debugger enabled at the same time, you can switch processes freely from the list for debugging. |
Windows
Next the debugging windows will be described. When the debugger hits a breakpoint, you can open a series of related windows from the menu Debug > Window to help you debug, including Breakpoints, Exception Settings, Watch, Autos, Locals, Call Stack, and Threads. In Breakpoints, Watch, Locals, and Call Stack windows, you can select multiple (by pressing Shift to select) or all (from right-click menu to select Select all) items in the list, and then perform operations such as copying, editing, and adding to watch.
Autos
This window shows the variables and values in the current statement as well as the previous line.
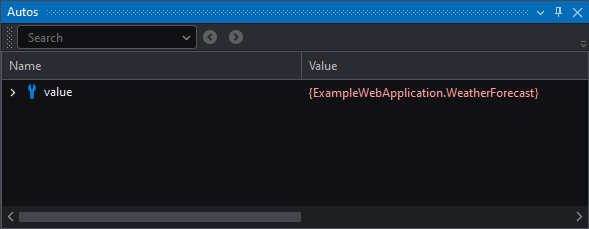
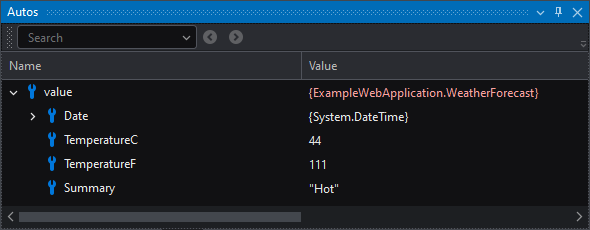
Complex values can be expanded to view their members.
String Visualizer
In the Autos, Locals, Watch and other windows, when viewing the variable value of string type, you can click the magnifying glass icon behind the variable value, and then select to view the value in the JSON visualizer, or text visualizer. Strings will be converted to JSON or TXT format for display.

Locals
Shows the variables and values in the current scope.
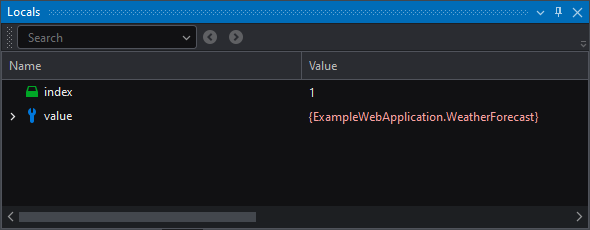
Complex values can be expanded to view their members.
It currently shows the same variables as the Autos window. This is due to the rather simplistic example.
Watch
Tracks the value of a variable or expression on a specific context. When scoping outside the context of the variable / expression the watch is preserved but its value will be unavailable.
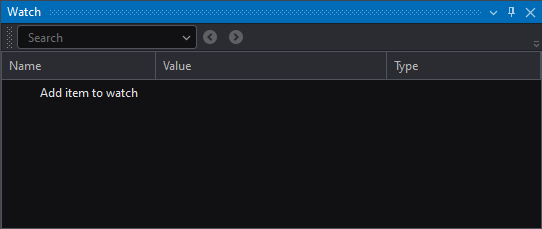
To add a watch, click the Add item to watch field and introduce the name of the variable or expression to track. The syntax for the expressions is the same as C# expressions.
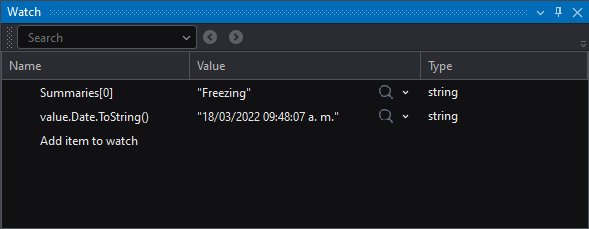
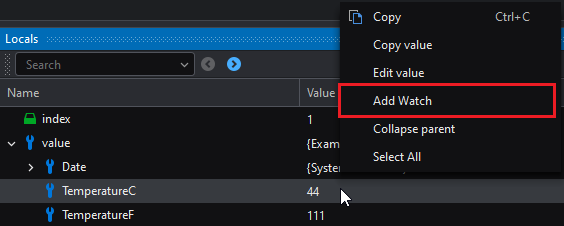
You can also create a watch from the Locals/Autos windows by doing right-click > Add Watch.
Additionally, creating a watch from the code is also possible by doing right-click > Add Watch on a variable:
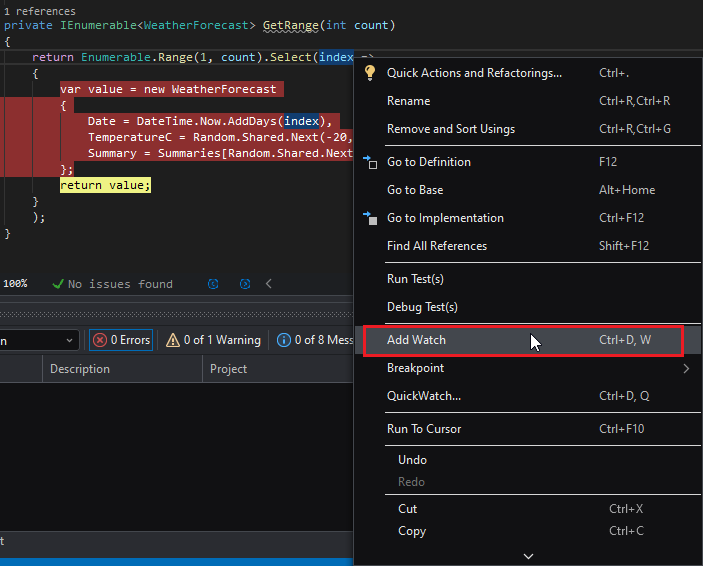
Quick Watch
The Quick Watch window is similar to the Watch window, the difference is that Watch can display multiple variables at the same time, and Quick Watch only displays one variable or expression at a time.
The Quick Watch window cannot be opened from the Debug > Window menu. To open the Quick Watch window, you must right-click on a variable or expression and select Quick Watch.
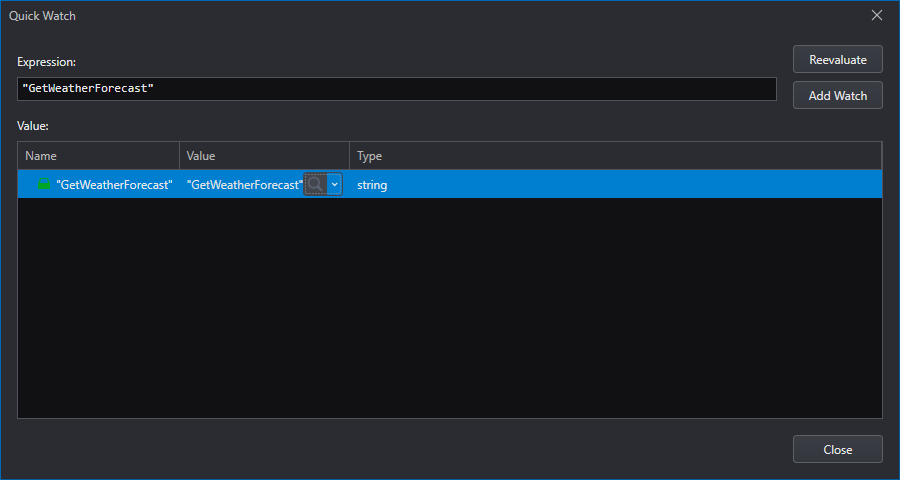
Call Stack
The Call Stack window shows the order in which methods and functions are being called.

The current method is at the top, its caller next, and so on. Code without debug information is listed as External Code. To show these elements anyway do right-click > Show External Code.
Double clicking on an element in the Call Stack window will attempt to show the code defining that method.
Threads
This window shows the threads that are currently running for the program, as well as an indicator of what thread is currently paused.

The columns are described as follows:
| Column | Description |
|---|---|
| Flag | Mark threads you want to pay special attention to. |
| ID | The ID for the thread. |
| Managed ID | The ID for managed threads. |
| Category | The category of the thread. Usually user interface threads, remote procedure call handlers, worker threads. |
| Name | The name of the thread, if it has one. |
| Location | The location where the thread is running. Double clicking it reveals the full Call Stack. |
| Priority | Displays the priority of the thread assigned by the system. |
| Affinity Mask | Determines on which processors a thread can run. |
| Process ID | The ID of the process. |
| Process Name | The name of the process. |
| Suspended Count | Determines whether a thread can run. |
| Transport Qualifier | ID of the machine to which the debugger is connected. |
Breakpoints
The Breakpoints window shows all the breakpoints on the current solution, their location and an overview of its settings.

The buttons are described as follows:
| Icon | Description |
|---|---|
| Delete the selected breakpoints | |
| Delete all breakpoints matching the current search criteria | |
| Enable or disable all breakpoints matching the current search criteria | |
| Go to Source Code | |
| Show Columns | Select which columns will be shown |
| Search | Input the search text |
| In Columns | Specify which columns should be searched |
| Reset all search criteria so that all breakpoints are shown |
Breakpoint Settings
Right-click > Settings on a breakpoint to open the Breakpoint settings for it:

Conditions
You can specify conditions so as to make the breakpoint trigger and pause the debugger only when the conditions are met.
There are 2 types of conditions:
Condition Expression -- A C# expression that is evaluated every time the code on the breakpoint is executed. This expression is scoped to the line on which the breakpoint is set.
Hit Count -- Condition that checks the number of times the current line has been executed. You can use the expressions
=,multiple ofand>=.
Add a new condition with the parameters shown and press Enter to accept it.

Now the breakpoint will only be triggered when the index variable has a value of 5.
Conditional breakpoints have the ![]() icon.
icon.
Actions
You can specify actions so as to show a message in the Output window and choose whether to continue code execution. The message you want to show can be written in the dialog box.

Exception Settings
This window allows you to select which exceptions will trigger a breakpoint.
Exceptions are grouped by type. You can expand an exception type node in the list (currently only the Common Language Runtime Exceptions node), and then select the checkbox for one of the exceptions to enable that exception. You can also select all exceptions under a type node by selecting its checkbox. When the exception's checkbox is checked, the debugger will break execution at the place where the exception was thrown, regardless of whether the exception has been handled or not.
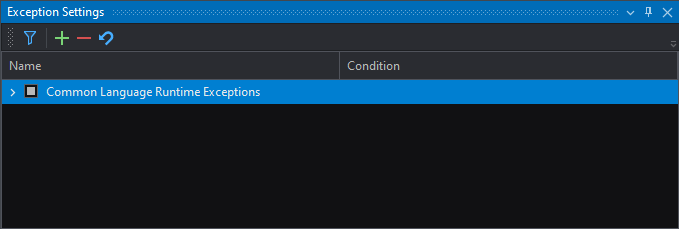
The window has the following actions:
| Button | Description |
|---|---|
| Only Show Enabled Exceptions. Make the list only show the exceptions that are enabled. | |
| Add an exception to the selected category. | |
| Delete the selected exception from the list. | |
| Restore the list to the default settings. |
When entering the line of code where an unhandled exception occurred, an Unhandled Exception window appears (as shown in figure below). After clicking View Details, the Quick Watch window will open.
Multi-process debugging
You can select a project and then select the Debug > Start Debugging menu; then go ahead and select the second project and select the Debug > Start Debugging menu. When two or more projects are enabled for debugging at the same time, the debugger will automatically enter the multi-process mode. At this time, you can switch the currently debugged project through the Process drop-down list on the toolbar.

Attaching to a Process
You can attach the debugger to a process that is already running. In order to unlock all of the debugger's features when attaching to a process, the debugger should be able to load its debugging information.
Stop the current debugging session by clicking on the Stop button in the debugging toolbar.

Now start the application without debugging by going to Debug > Start Without Debugging or with the button in the debugger toolbar.

Go to Debug > Attach to Process.
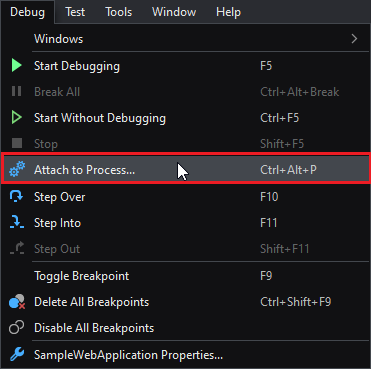
The Attach to process will show up:
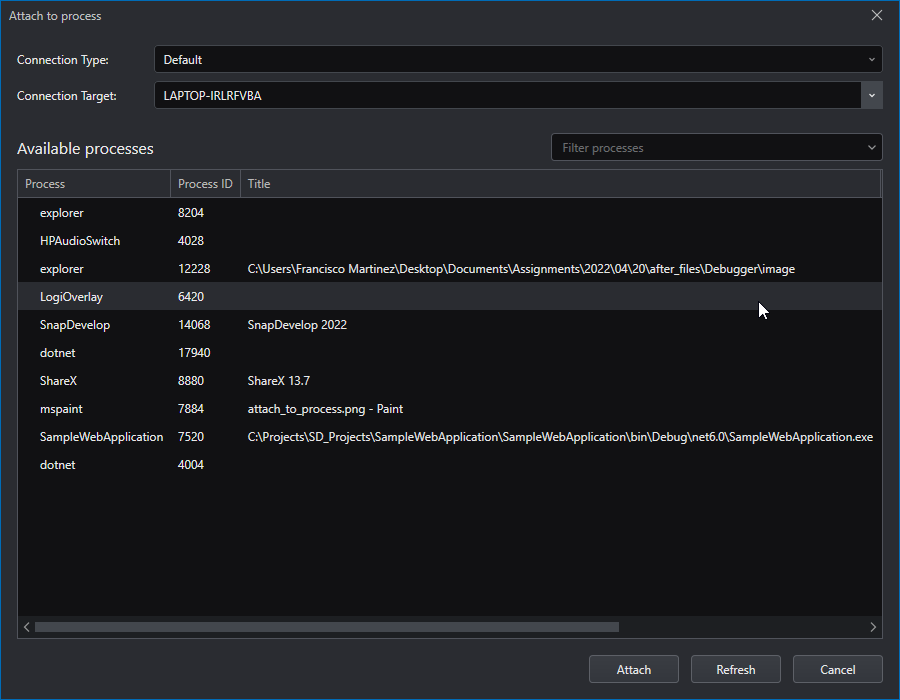
This window has the following fields:
| Field | Description |
|---|---|
| Connection Type | The debugger connection type. Default is the native OS debugger implementation |
| Connection Target | The connection target. In the Default connection type, this means the machine to which connect |
| Available processes | Process list filter |
The Attach to process window lists the processes it may attach to. Please keep in mind that not all processes can be debugged, because they might not have their debugging information available.
In the process list select the ExampleWebApplication (or the name of your project) process and click Attach.
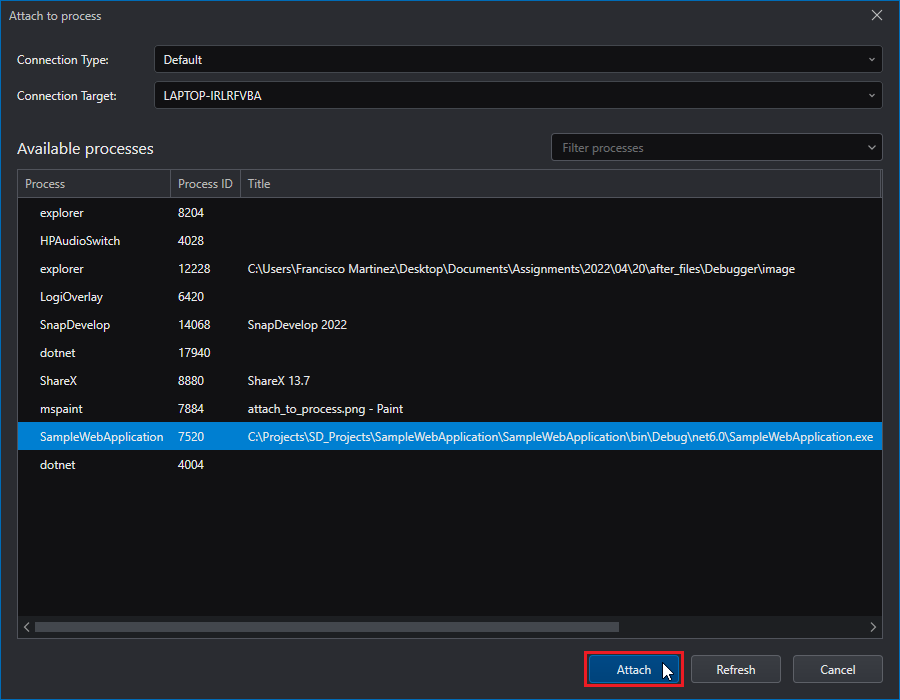
The debugger will attach to the process. You can verify this by opening the URL http://<api_url>/weatherforecast where <api_url> is the URL the Web APIs are listening on (you can obtain this value from the Web APIs Console Window).
Debugging a project in Docker or Kubernetes
Debugging your project in a Docker or Kubernetes environment means that at any time during the development and testing phases, you can choose to debug your project on Docker or Kubernetes to ensure that the program runs correctly in the Docker or Kubernetes environment.
First make sure that the corresponding support (such as Container Support, Container Orchestration Support, or Kubernetes Support) has been added to the project, and breakpoints have been set.
You can choose to run the configuration as Docker, Kubernetes, or KubernetesCompose only after the appropriate support has been added. For more information about how to add Docker or Kubernetes support, refer to Docker Support and Kubernetes Support.
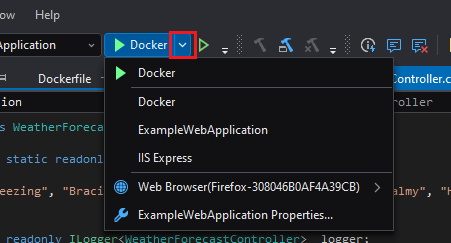
Once the configuration runs, a debug image and a container will be created and the debugger will automatically attach to the container.
Debug settings
The debug settings allow you to configure the debug profiles for the projects in your solution. You can access the debug settings by right-clicking on the project node in the Solution Explorer and then selecting Properties > Debug.
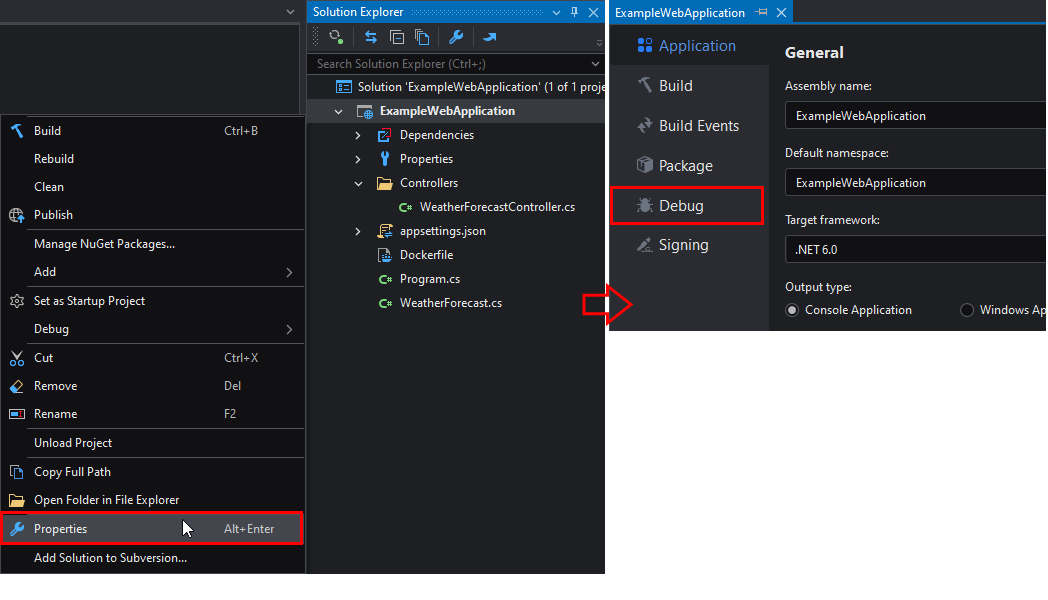
Depending on the selected profile type the options shown may differ. For more details, refer to Debug.