Web API Tester
Last updated: August, 2022
Web API Tester is a tool built into SnapDevelop which allows you to quickly test your APIs without leaving the application.
It provides the following features:
- Normal testing mode and debug testing mode;
- Import & Export: Importing or exporting APIs from/to Swagger or another Web API Tester instance;
- Proxy, Cookie & Authorization: Specification of proxy, cookies and various authorization schemas (basic authorization, bearer token, and OAuth 2.0) for the test;
- Pre-Scripts and Post-Scripts: Setting the pre-scripts and/or post-scripts to perform before and/or after sending the request;
- Mock: Ability to mock responses or API parameters.
- You can start API mocking service and define mock responses for an API. Then the active mock response will be the result to return from the API.
- With the parameter mocking feature, it is possible to directly test an API without relying on other APIs passing parameter values to it.
- Environment: Defining various environments (i.e. different values for the same set of variables) for use in Params, Headers, Body, Pre-Scripts and Post-scripts.
Settings
The general settings for Web API Tester can be found through the menu Test > Web API Tester. Use the following setting to control the global behavior of the Web API Tester.

- Use Cookies -- Enables the use of cookies in the requests.
- Enable parameter mocking -- Enables/disables the parameter mocking feature.
- Auto mock parameter data when API is opened --Enables/disables auto-populating the default mocking values for the parameters in the Params tab.
- Allow auto redirect -- Enables support for URLs that return redirects and allows to set up the maximum number of redirects allowed.
- Maximum response size -- Determines the maximum response size to accept, and the action to perform when this size is exceeded.
- Request timeout -- The maximum time, in seconds, to wait for a response from the endpoints.
- Use Proxy -- Configures the use of proxy for the requests.
- Use system proxy -- Uses the system proxy settings.
- Configure global proxy settings -- Configures the global proxy settings.
Main toolbar of the tester
To open the Web API Tester, right click in the code editor view and then select Run Tests, or select menu Test > Web API Tester.
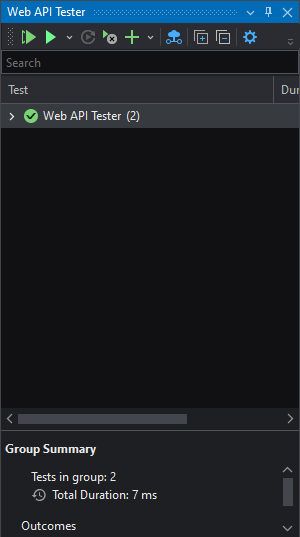
The main toolbar of Web API Tester above the Request Tree View has the following buttons:

| Button | Description |
|---|---|
| Run All Tests in View | Runs all the tests contained in the current view. |
| Run | Runs the currently selected test. The menu shows more options for running. |
| Repeat Last Run | Repeats the last run test. |
| Run Failed Tests | Runs the tests that were unsuccessful in the previous run. |
| Add | Creates a new Test, or click the arrow to import a Swagger Web API. |
| API Mocking Service | Monitors all the APIs that have one or more mock responses defined. Allows to start or stop the API mocking service, or set one mock response as the current one. For more information, refer to Mocking response. |
| Expand All | Expands all nodes in the view. |
| Collapse All | Collapses all nodes in the view. |
| Options | Opens the options window for the Web API Tester. |
Request Tree View
The tree view shows entries grouped into 4 categories:
- Histories
- Project endpoints
- Swagger
- Default group
All request entries will have an icon indicating the status of their last run. Green for success, blue for unrun, red for failure and yellow for warning; alongside a label indicating the request's method (GET, POST, etc.).
![]()
Histories
This group contains the history of the requests that have been executed so far, further grouped by their relative date:
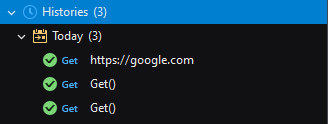
These requests won't persist in their changes either.
Project
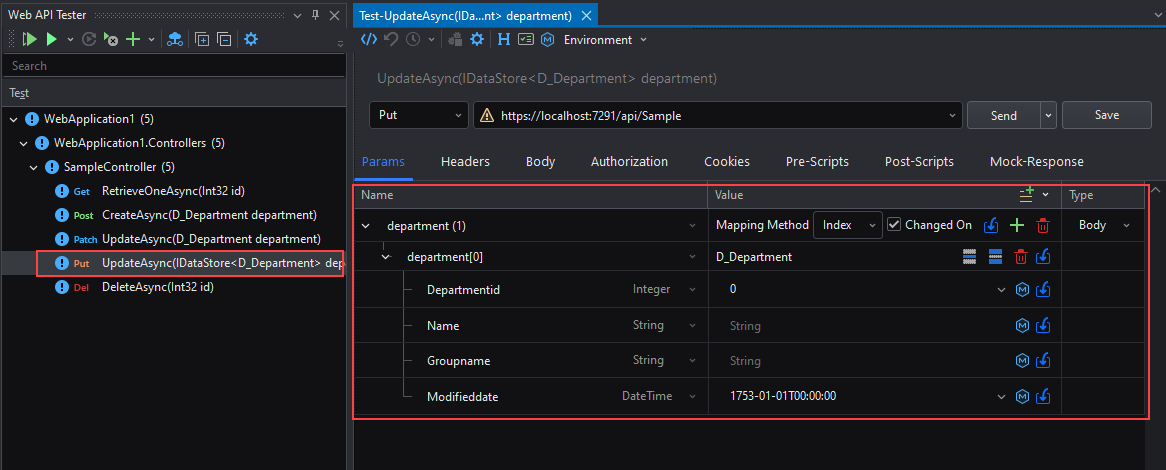
This group of tests will be automatically generated from the project's controllers. They can be temporarily modified, but their changes are lost when the tab is closed, and the name of the test will be the method's signature (method + parameters). If these methods require parameters, they will be already added to the request template:
Swagger
When you import a Swagger API (by clicking ![]() > Import on the panel's toolbar), a Swagger group is automatically created. The requests in this group will not keep the changes.
> Import on the panel's toolbar), a Swagger group is automatically created. The requests in this group will not keep the changes.

For more details about how to add a Swagger Web API, refer to Importing a Swagger API.
Default group
This group contains requests created by the user (via the Add button):

For more details about how to add a request, refer to Adding a Web API.
Request Details View
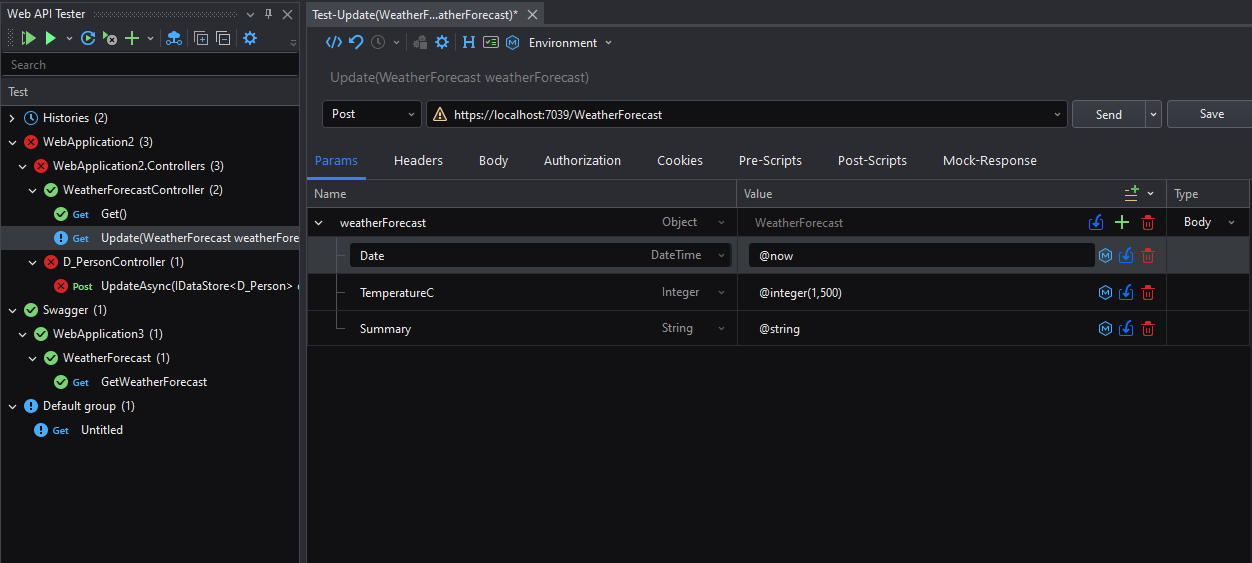
When you double click on a request in the tree view, its details can be seen in a separate view:
Request operation toolbar
The request operation toolbar in the details view contains the following buttons:

| Icon | Button | Description |
|---|---|---|
| Go to code | Redirects to the code segment in which the current endpoint is defined. | |
| Restore | Returns the request's settings to the default, essentially clearing the parameters, mocking, headers, etc. to their default state. | |
| History | Shows the execution history for the current test | |
| Stop the currently running project | When the tests are run, the Web API Tester starts an instance of the application. If you make any changes to the code the instance will be restarted, but if you need to start another instance separately for whatever reason, you will need to stop this instance to avoid port conflicts. | |
| Options | Opens the Web API Tester global settings. | |
| Default headers settings | Opens the Default Header Settings window. | |
| Default authentication settings | Opens the Default Authentication Settings window. | |
| Mock Settings | Allows to define the default mock settings for the request. Mocking refers to "Mock data" i.e. randomly generated data. In this window you can define the parameters that will constrain these generators (character length, number minimums and maximums, etc.). | |
 |
Environment | Opens the Environment Variables window for you to configure the environment variables that can be used in the Params, Headers, Body, Pre-Scripts and Post-scripts. For more information, see Environment. |
Default Header Settings
The Default Header Settings window is made up of two sections:
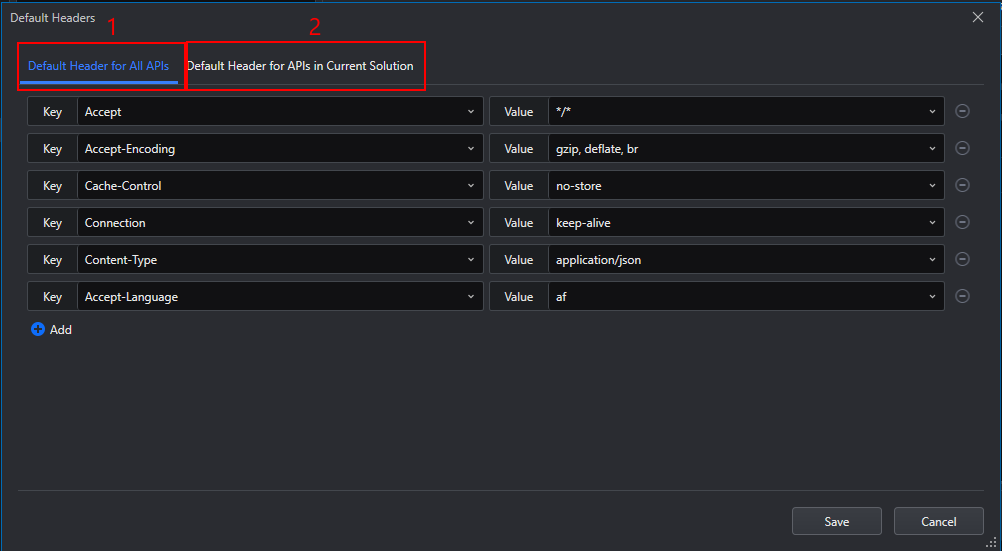
- Default Header for All APIs -- These headers will be applied to APIs across solutions.
- Default Header for APIs in Current Solution -- These headers will only be applied to APIs in the current solution.
Use the Add button ( ) to add new header entries and the Remove button (
 ) to remove the header entry.
Default Authentication Settings
Configures the authentication scheme to be used by default by all the requests.
For details on how to use this feature., refer to the Authorization section.
Environment
You may set one or multiple environments for the test. For example, an environment called "Development" might define the environment variables API_URL, USERNAME, and PASSWORD to signify the credentials for authenticating on the development server, while a different environment called "Production" defines them to be the appropriate credentials for the production server. You can use the variables defined in the environment in Params, Headers, Body, Pre-Scripts and Post-scripts.
Defining variables in an environment
Clicking the Environment ( ) button to open the Environment configuration window.
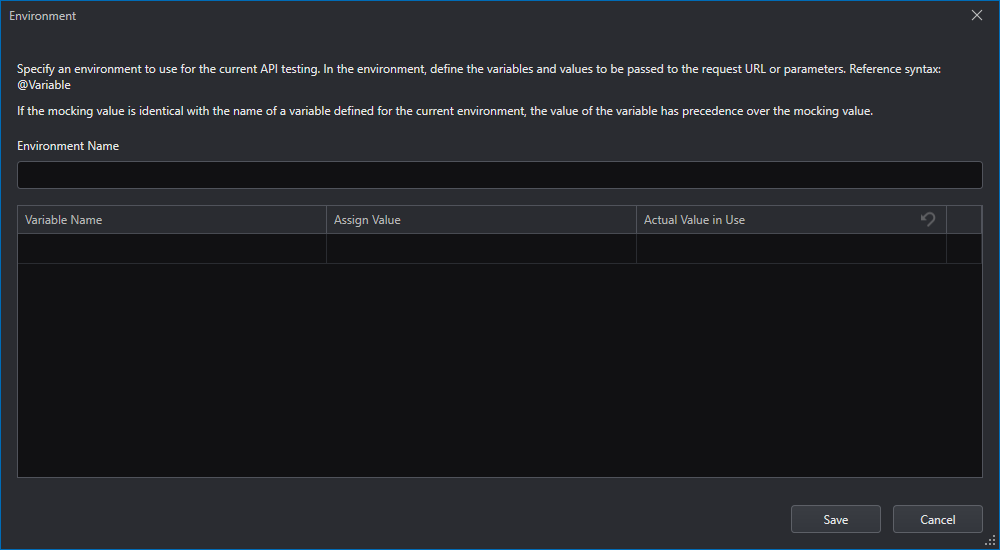
Then you need to configure the following basic settings:
Environment Name -- Specifies the name of the environment.
Variable Name -- Specifies the name of the variable that you hope to use in the Params, Headers, Body, Pre-Scripts or Post-scripts tab.
Assign Value -- Assigns a value for the variable.
Actual Value in Use -- During the test, the value of the variable may be changed. You can view the actual value in this column.
You can click the Reset button at the Actual Value in Use column to reset all the variable values to the assigned values.

Selecting an active environment
Once you have created one or more environments, you must select one environment as the active one for the current test, which means that the variables defined in the active environment will apply during the test.
You can set an environment as active by selecting it from the Environment dropdown.

Params
The Params tab configures the parameters for the request's query, form, body and header.
Use the Add button to insert a new parameter (or use the button's menu to insert a parameter of a certain type).

When you add a new parameter, you need to configure the following basic values:

Name -- The name of the parameter that you are adding.
Data Type -- The data type of the parameter.
Common data types (string, char, etc.) are only relevant in IDE, as parameters in HTTP requests are always strings (even files, base64-encoded).
For object type parameters, its public properties will be shown as individual parameters.

Array type parameters shall be one-dimensional array, the actual parameter type and value will be shown as the child node of the array.

Value -- The value of the parameter. You may specify the actual value, or specify an environment variable following the instructions at the Environment section, or specify a mocking value following the instructions in the Mocking parameters section. If no value is given, the default mocking value will apply.
Mock -- Click the icon to add a mocking value for the parameter. This icon is only enabled if you have selected the Enable parameter mocking option in the Options > Test > Web API Tester. For instructions on how to set a mocking value, see the Mocking parameters section.
Retrieve -- Click the icon to retrieve a value into the Value field. For further information, see the Retrieve a value section.
Delete -- Click the icon to remove the parameter.
Type -- The type of parameter (Query, Form, Body, Header). Query parameters are embedded in the request's URL, Body parameters become the request's body, and Header parameters go in the request's header.
Mocking parameters
If you enable the parameter mocking feature (refer to Settings), you can quickly start tests on an API without the necessity of specifying individual parameters for the API.
Configuring default mocking parameters
Clicking the Para Mocking button (![]() ) to open the Para Mocking Settings window. In the window, you can define default mocking values for specific data types and parameter names at the solution level.
) to open the Para Mocking Settings window. In the window, you can define default mocking values for specific data types and parameter names at the solution level.

There is already a system default mocking value for each data type. For example, @string for the String data type, meaning a string value will be randomly generated.
Clicking the Para Mocking button (
 ) at a mocking value. A popup will display, in which you can create or adjust the generation rule for the mocking value.
For example, the String mocker has the following settings:
Setting Description String pool The set of characters from which to generate the string. Min The minimum length of the string. Max The maximum length of the string. Clicking the Plus button (
 ) at a data type, you can enter the parameter name of the data type and then specify a default mocking value for parameters with the parameter name.
The rules are matched by parameter name (higher priority) and then by data type (lower priority). For example, setting the rule A after the string type will take effect for all string types; if you click the + sign after the string, a sub-rule will be added under the string type, if you fill in name in the Parameter Name and set the rule B, then for the name of type string, rule B will be applied, and other string attributes will still apply rule A.
The mock settings for array are special. You can only specify the mocking scope (the possible number of elements to be assigned to the array) in the Para Mocking Settings window. For the array elements, the default mocking values will follow the generation rule of the corresponding data type, or the parameter name that is the same as the array.

Specifying mocking parameters for individual APIs
In the Params tab of an API, you can specify mocking values for the API parameters.

The following are the possible ways to specify a mocking value for a parameter:
- If you have enabled the Auto mock parameter data when API is opened option (refer to Settings), simply moving the cursor to the Value field will populate the default mocking value configured in the Para Mocking Settings window to the field.
- Click the Para Mocking button beside the Value field. A popup will display, in which you can create or adjust the generation rule for the mocking value.
If you add a parameter of the FileCollection, Object, or Array data type, there is a Plus button ( ) beside the Value field. You can click the Plus button to add elements and the mocking values of the elements in the parameter.
In the Array data type, the mocking scope refers to the possible number of elements to be assigned to the array. For example, if the mocking scope is 1-10, there may be 1, 2, 3..., or 10 elements assigned to the array. If the mocking scope is 10-10, there will be 10 elements assigned to the array.
Retrieve a value
In the Params, Body, or Mocking-Response tab, if you click the Retrieve button ( ), you can specify how to retrieve a value into the corresponding field.
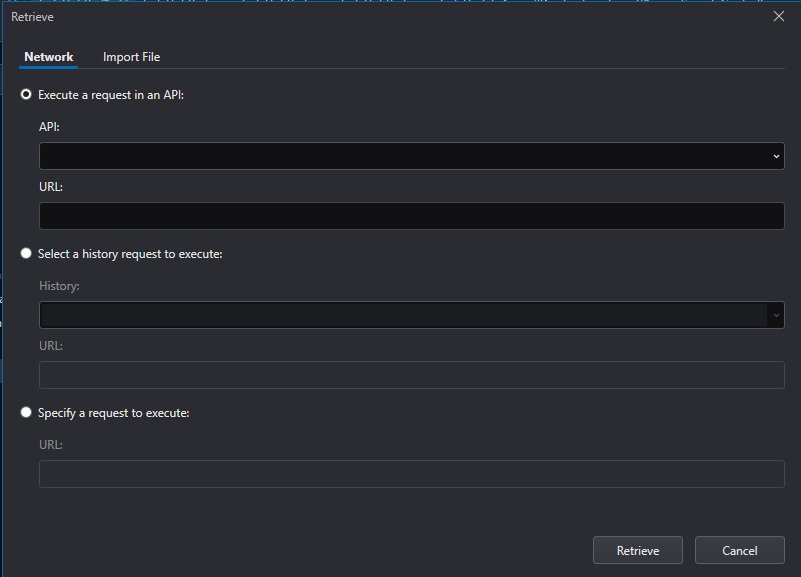
As shown in the window, there are two ways to retrieve values:
- Network -- You can specify a request to execute, and the response will be the value to use.
- Import File -- You can specify a file, and the file content will be the value to use.
Headers
The Headers tab configures the request's headers. The Default Headers configured in Default Header Settings are automatically embedded here.
Body
The Body tab allows you to view and modify the contents of the request's body.
You can modify the request body in the following ways:
Auto -- Shows the request's body as it will look like using the Body type parameters defined in the Params tab. The display format used is determined by the format selector.
Raw -- Allows manually inputting the contents of the request's body.
It has the following actions:
Button Description Import Imports the text from a text file. Retrieve Retrieves the text from an HTTP endpoint, which can be originated from the project itself, or can also be external. For further information, see the Retrieve a value section. Copy Copies the contents from the editor to the clipboard. Clear Clears the editor. The format selector determines the format of the body; it changes the Content-Type header.
Binary. Allows sending a binary file in the body of the request.
Authorization
The Authorization tab configures the scheme to use for the request. You can select from the following authentication schemes:
No Auth: Do not use authentication.
Basic Auth: A simple scheme that sends username and password encoded in Base 64 through the authentication header.
Bearer Token: A secure token (generally issued by the API or Authentication Authority) that identifies this request as authenticated.
API Key: A key-value pair containing a token that only the client and the server know, and that can be sent through the Header or as a Query Parameter.
OAuth 2.0: Use the OAuth 2.0 protocol for request authorization. See the following section.
OAuth 2.0
OAuth 2.0 is an authorization protocol that gives an API client limited access to user data on a web server. GitHub, Google, and Facebook APIs notably use it. OAuth relies on authentication scenarios called flows, which allow the resource owner (user) to share the protected content from the resource server without sharing their credentials.
For more information on the OAuth 2.0 protocol, follow this link.
Creating an Access Token
To create an access token, click Get New Access Token:
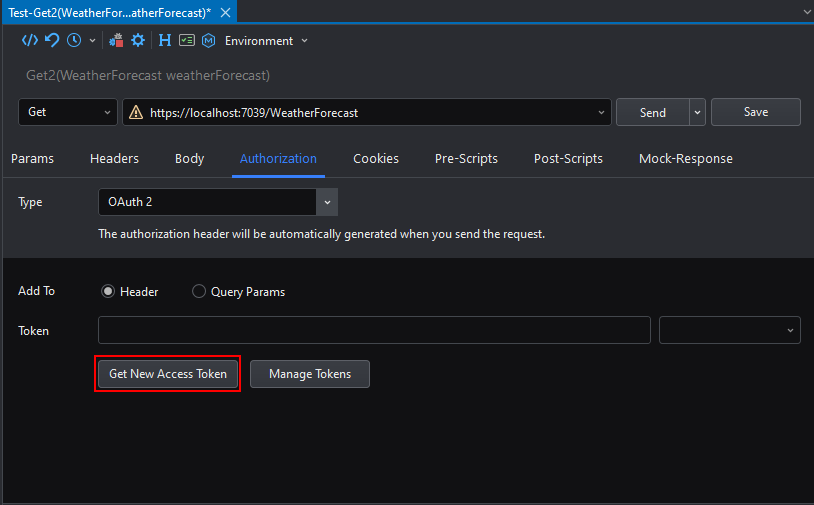
This will open the Get New Access Token window, in which you can select the specific Grant Type you want to use and fill the necessary information. For more information about Grant Types, please see the OAuth 2.0 Specification.
After filling the data, click Request.
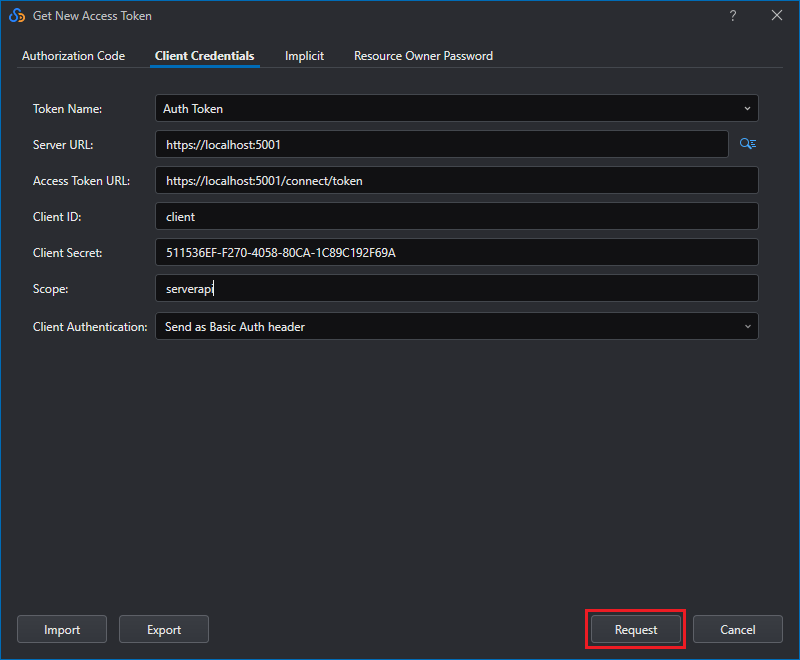
The authorization request will be sent and if successful, saved.
Once created, the token to be used can be selected on the Authorization Token selector:

Managing Access Tokens
To manage Access Tokens that have been created and are currently saved, click the Manage Tokens button:

This will open the Token Manager window, which will display information about the saved tokens.
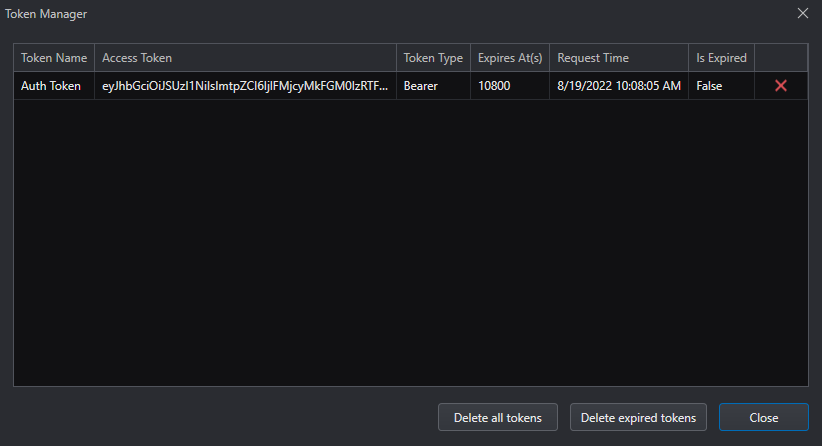
You can delete the tokens one by one, or all tokens at a time, or only the expired tokens.
Cookies
The Cookies tab configures the cookies that the request will use. It has the following toolbar buttons:
| Button | Description |
|---|---|
| New Cookie | Shows a window to configure a new cookie. |
| Import | Imports a text file containing cookie settings and imports it to the request. |
| Export | Exports the current cookie settings to a text file. |
Pre-scripts and post-scripts
The Pre-Scripts tab allows you to set what scripts to perform before sending the request. and the Post-Scripts tab allows you to set what scripts to perform after sending the request.

There is a list of pre-defined scripts (pre-defined functions belonging to the "apitester" class) at the right panel in both the Pre-Scripts and Post-Scripts tab. You may double click one item (for example, "Set an environment variable" ) to insert the corresponding script to the tab and then update the script based on your actual needs.
Mocking response
Before an API is ready, you can start API mocking service, and define mock responses for the API, to get mocking results during the test.
Starting the mocking service
The first time you open the Mock-Response tab, you will be prompted to start the mocking service.

Click the Start link, a mocking request URL will be provided by the mocking service for the API.

During the API test, when the actual URL is called, the mocking request URL will be the one responding with the currently-active mock response.
Defining mock responses
Clicking the Add button in the Mock-Response tab to define mock responses. The Add dropdown contains different response status codes (200, 201, etc.).
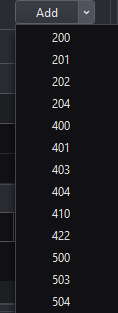
You can define multiple responses, each for one response code.
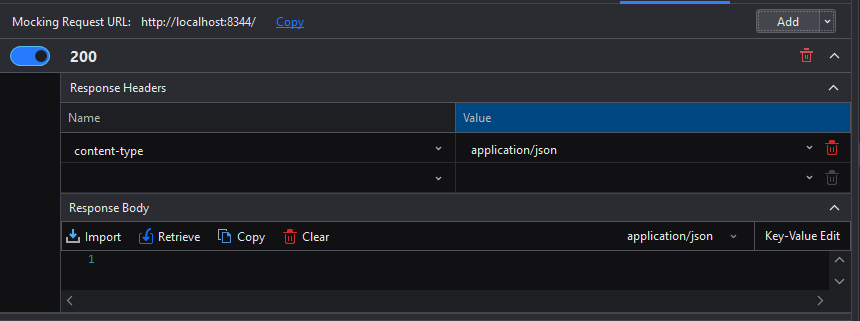
If there are indeed multiple responses, only one can be set as the active one to use.
| Active/Inactive button | Description |
|---|---|
 |
Indicates that the response is the active one to use. |
 |
Indicates that the response is inactive. |
The Response Headers configures the response's headers.
The Response Body configures the actual body of the response. Besides manually writing scripts, you can take the following actions:
| Button | Description |
|---|---|
| Import | Imports the text from a text file. |
| Retrieve | Retrieves the text from an HTTP endpoint, which can be originated from the project itself, or can also be external. For further information, see the Retrieve a value section. |
| Copy | Copies the contents from the editor to the clipboard. |
| Clear | Clears the editor. |
Managing API mock service
You can click the API Mock Service button in the Web API Tester toolbar to manage the API mock service and the mocking responses.

The API Mocking Service window displays and enables you to view and manage all the APIs with mock responses.

- You may enable or disable the API mocking service, together with the mock responses, with a single click at the start/stop button in the toolbar.
- In the API list, you see each API that has mock response, each with the currently-active response code shown in the Mocked Response column. You can change the active response code to another one by clicking the dropdown in the column.
Adding Web APIs for Test
Web APIs auto loaded
When you run Web API Tester, the Request Tree View loads the Web APIs from historical records, and from the current project's controllers.
Adding a Web API
To add a request, click the Add button in the main toolbar of the tester, then select the request type, enter the request URL, set parameters, request headers, body, etc., and finally click the Save button. The API will be added to the Web API Tester tree.

Exporting and importing a Web API
Export
Click the dropdown beside the Add button in the main toolbar of the tester and then select Export, you can export all the Web APIs in the Request Tree View to a .JSON file.

Import
You can import Swagger APIs, or import the Web APIs from the .JSON file that is generated through the export operation in another Web API Tester instance.
To import Web APIs, click the Add > Import button. The Import window provides two approaches for importing Web APIs.
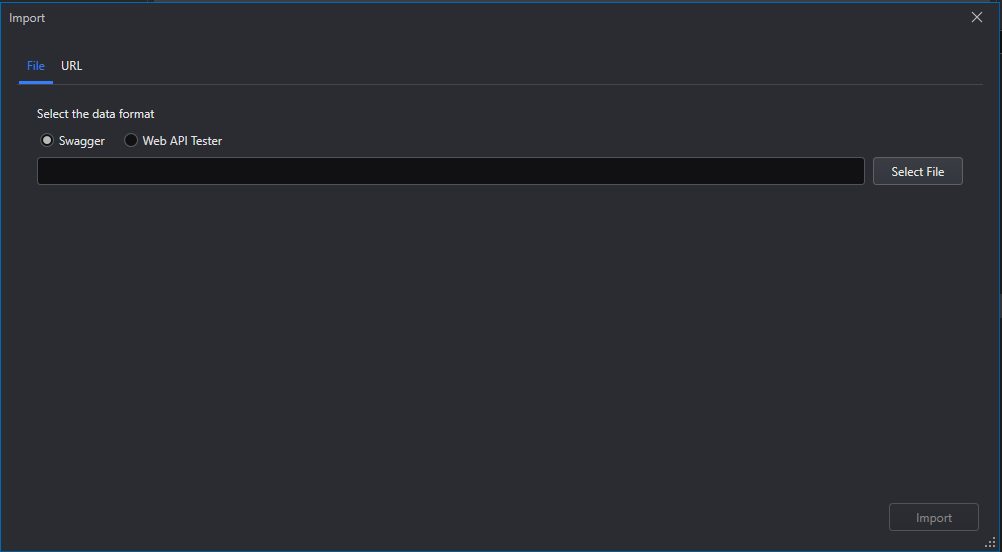
- Select the File tab, and then import by specifying a Swagger JSON file, or a .JSON file that is generated through the export operation in another Web API Tester instance.
- Select the URL tab, and then specify the URL to a Swagger JSON file.
The API will be added to the Web API Tester tree.

Running Tests
Starting the Web API service
When running a test (or sending a request), if SnapDevelop detects that the corresponding Web API service is not started, the Start Project window will pop up. The value of Configuration is the name of the configuration profile in the Debug page of the project properties panel. In this window, you can select the project to start and the configuration profile, and then click OK.

From the Web API Tester tree view
Right click on a request in the Web API Tester tree view and then select Run:

The results will be shown in the Test Detail Summary panel at the bottom:
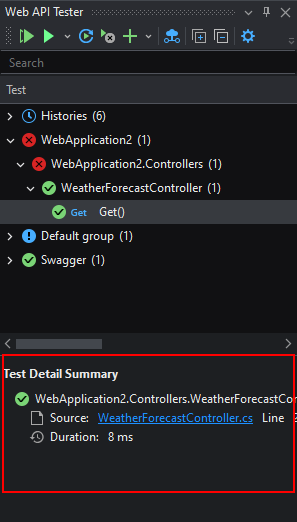
If the test fails (for example, the API responded with a non-successful result code) the error will be visible in the same panel with some additional info:

This approach to running the tests is more useful for quickly evaluating a test and seeing if it succeeds or not. For specifying the parameters, headers and authentication scheme of a request, as well as reviewing the response body, see the following method.
From the Web API Tester detail view
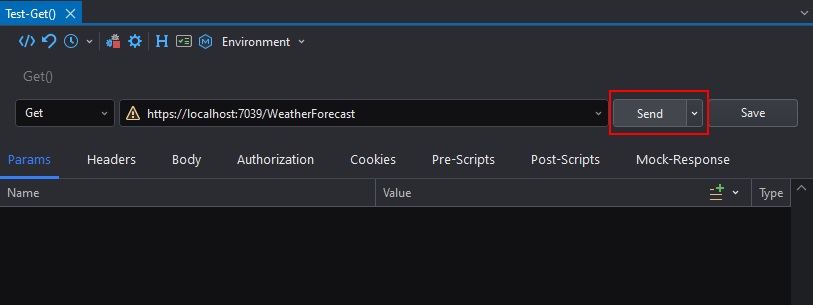
Open the Web API Tester detail view by double-clicking on a particular test.
Customize the request as necessary and then click the Send button.
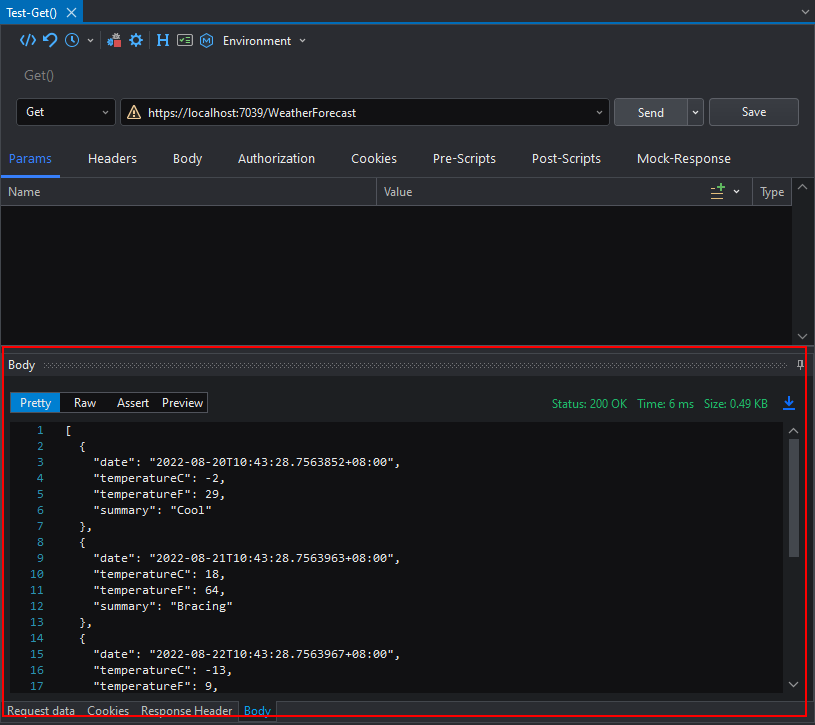
The response content will show up at the bottom of the view:
From the code editor
Right click on a controller method mapped to an endpoint and then select Run Tests:

The corresponding detail view will open and the request will run automatically.

Debugging Tests
Debugging a test means running the Web APIs in debug mode. When the code processing a request runs into a breakpoint, the execution will be paused and you'll be able to explore code execution and the variables line by line. For more information on debugging, follow this link.
From the Web API Tester panel
Add breakpoints to the code first, and then start debugging in the following ways:
a) Select a test and then select Debug from the toolbar button:

b) Right click on the test in the tree view and then select Debug:

From the Web API Tester detail view
With a request opened in the detail view, click on the arrow of the Send button and then select Debug:
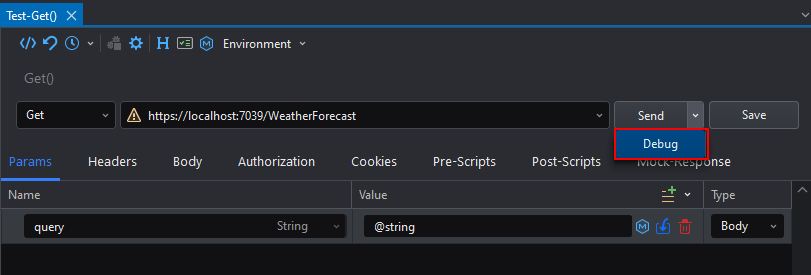
Please note that this button will only show when the opened test is in the Project and Histories groups, it won't show if the test belongs to the Swagger or default group.
After clicking the Debug button, the Web APIs will be restarted on debug mode (if they weren't already) and the test will run. If there are breakpoints in the code path, the execution will pause and you will be led to the breakpoint, otherwise, the request will be executed normally.
From the code editor
Right click on a controller method mapped to an endpoint and then select Debug Tests:

The corresponding detail view will open and the request will run automatically in debug mode.