Modifying properties at runtime described how you can use conditional expressions that are evaluated at runtime to highlight information in a DataWindow object.This section presents a procedure for modifying properties at runtime and some examples.
To modify properties conditionally at runtime:
-
Position the pointer on the control, band, or DataWindow object background whose properties you want to modify at runtime.
-
Select Properties from the pop-up menu, then select the page that contains the property you want to modify at runtime.
-
Click the button next to the property you want to change.
-
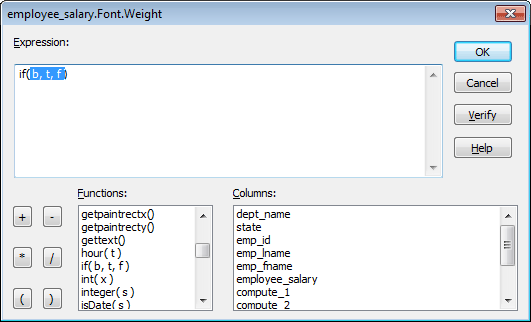
Scroll the list of functions in the Functions box until you see the IF function, and then select it:
-
Replace the b (boolean) with your condition (for example, salary>40000).
You can select columns and functions and use the buttons to add the symbols shown on them.
-
Replace the t (true) with the value to use for the property if the condition is true.
Values to use for properties are usually numbers. They are different for each property. For more information about property values that can be set on the Expressions page, see Supplying property values.
Set Font.Weight property to 700 for bold
Font properties such as Italic, Strikethrough, and Underline take a boolean value, but to specify a value for bold, you use the Font.Weight property, which takes a range of values. For values and an example, see Font.Weight.
For complete information about what the valid values are for all properties of controls in the DataWindow object, see the discussion of DataWindow object properties in DataWindow Object Properties in DataWindow Reference.
-
Replace the f (false) with the value to use for the property if the condition is false.
-
Click OK.
For examples, see Example 1: creating a gray bar effect, Example 2: rotating controls, Example 3: highlighting rows of data, and Example 4: changing the size and location of controls.
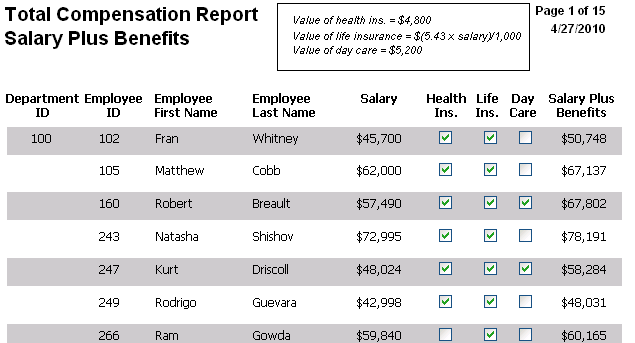
The following DataWindow object shows alternate rows with a light gray bar. The gray bars make it easier to track data values across the row:
To create the gray bar effect:
-
Add a rectangle control to the detail band and size it so that it surrounds the controls you want highlighted.
-
To make sure that you have selected the detail band, select the Position tab in the Properties view and select Band from the Layer drop-down list.
-
To make it easier to see what you are doing in the Design view, select the General tab and set the Brush Color to White and the Pen Color to Black. A narrow black line forms a boundary around the rectangle.
-
Select Send to Back from the rectangle's pop-up menu.
-
To hide the border of the rectangle, set the Pen Style to No Visible Line.
-
Click the button next to the Brush Color property on the General page.
-
In the Modify Expression dialog box, enter the following expression for the Brush.Color property:
If(mod(getrow(),2 )=1, rgb(255, 255, 255 ), rgb(240, 240, 240 ))
The mod function takes the row number (getrow()), divides it by 2, then returns the remainder. The remainder can be either 0 or 1. If the row number is odd, mod returns 1; if the row number is even, mod returns 0.
The expression mod(getrow(),2)=1 distinguishes odd rows from even rows.
The rgb function specifies maximum amounts of red, green, and blue: rgb (255, 255, 255). Specifying 255 for red, green, and blue results in the color white.
If the row number is odd (the condition evaluates as true), the rectangle displays as white. If the row number is even (the condition evaluates as false), the rectangle displays as light gray (rgb (240, 240, 240)).
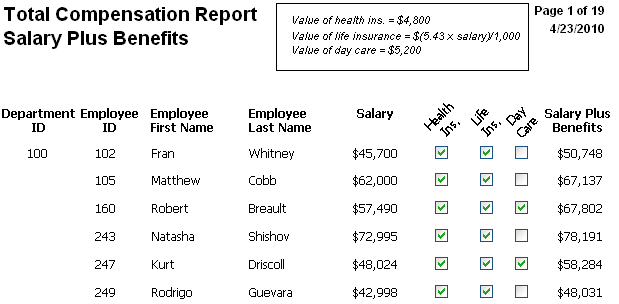
The following DataWindow object shows the column headers for Health Insurance, Life Insurance, and Day Care rotated 45 degrees.
To rotate each of these three text controls:
-
Select one of the controls, then use Ctrl + click to select the other two controls.
The Properties view changes to show the properties that are common to all selected controls.
-
On the Font page in the Properties view, click the button next to the Escapement property.
-
Enter the number 450 in the Modify Expression dialog box and click OK.
The value entered for font escapement is in tenths of degrees, so the number 450 means 45 degrees. You do not have to specify a condition. Typically, you do not specify a condition for control rotation.
The rotation of the controls does not change in the Design view.
-
To see the change, close and reopen the Preview view.
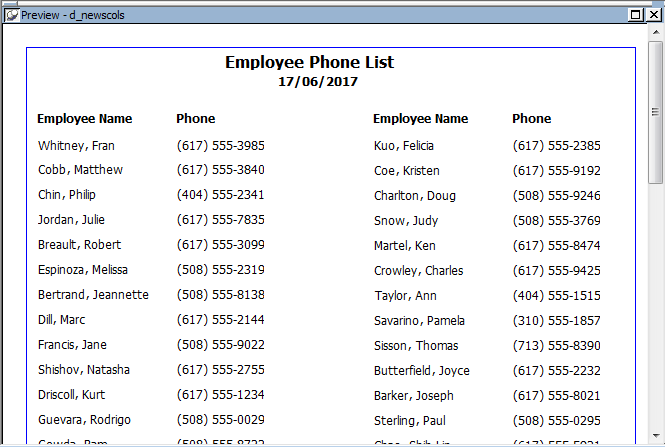
The following DataWindow object is an employee phone list for a company in Massachusetts. Out-of-state (not in Massachusetts) employees are shown in bold and preceded by two asterisks (**):
This DataWindow object uses newspaper columns. To understand how to create this DataWindow object without highlighting data, see Printing with newspaper-style columns.
In the Design view, the detail band includes four controls: the employee last name, a comma, the employee first name, and the phone number:
To make these controls display in bold with two asterisks if the employee is not from Massachusetts:
-
Select one of the controls, then use Ctrl + click to select the other three controls.
The Properties view changes to show the properties that are common to all selected controls.
-
On the Font page in the Properties view, click the button next to the Bold property.
-
Enter the following expression in the Modify Expression dialog box and click OK:
If(state = 'MA', 400, 700)
The expression states that if the value of the state column is MA, use 400 as the font weight. This means employees from Massachusetts display in the normal font. For any state except MA, use 700 as the font weight. This means all other employees display in bold font.
Logic that relies on the state column
To use logic that relies on the state column, you need to include the column in the data source. You can add the column after creating the DataWindow object by modifying the data source. Notice that the state column does not actually appear anywhere in the DataWindow object. Values must be available but do not need to be included in the DataWindow object.
-
To insert two asterisks (**) in front of the employee name if the employee is not from Massachusetts, add a text control to the left of the employee name with the two asterisks in bold.
-
With the text control selected, click the button next to its Visible property on the General page in the Properties view.
-
In the Modify Expression dialog box that displays, enter the following expression and click OK:
If(state = 'MA', 0, 1)
This expression says that if the state of the employee is MA (the true condition), the Visible property of the ** control is off (indicated by 0). If the state of the employee is not MA (the false condition), the Visible property of the ** control is on (indicated by 1). The asterisks are visible next to that employee's name.
Tip
You can use underlines, italics, strikethrough, borders, and colors to highlight information.
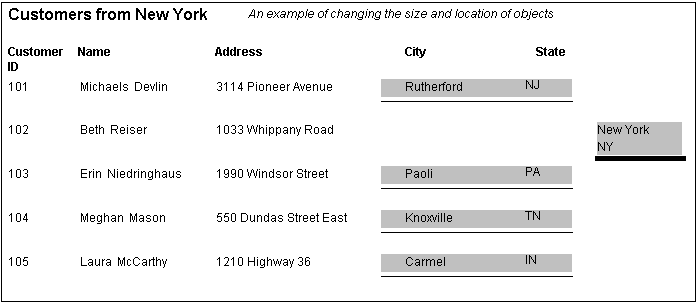
The following DataWindow object shows city and state columns enclosed in a rectangle and underlined. The columns change location if the current row contains data for a customer from the state of New York. The rectangle and the line change both location and size.
This example shows how to move the rectangle and line. The process for columns is similar.
In the Design view, the rectangle and line display in one location, with a single set of dimensions. The expressions you specify are used only in Preview view and at runtime and all have the following syntax:
If ( state='NY', true value, false value )
The false value is the same as the value in Design view. All of the values used in this example are in PowerBuilder Units (PBUs), the default unit of measure used for the DataWindow object.
To change properties of the rectangle and the line for rows with the state column equal to New York:
-
Select the rectangle, display the Position page in the Properties view, and specify expressions for the following properties:
Property
Expression
X
if (state = 'NY', 2890, 1865)
Width
if (state = 'NY', 500, 1000)
Height
if (state = 'NY', 160, 120)
-
Select the line, display the Position page in the Properties view, and specify expressions for the following properties:
Property
Expression
X1
if (state = 'NY', 2890, 1865)
Y1
if (state = 'NY', 168, 132)
X2
if (state = 'NY', 3400, 2865)
Y2
if (state = 'NY', 168, 132)
-
On the General page for the line, specify this expression for Pen Width:
if (state = 'NY', 10, 4)
At runtime, the rectangle is taller and narrower, and the line is shorter and has a wider pen width.


