Where you are
Open the report to contain the graph
Now you save the graph. The graph is part of the report, so to save the graph, you save the report that contains it. To leave the original report unchanged, you will use the Save As command. Save As saves a new report with the name you supply.
-
Select File>Save As from the menu bar.
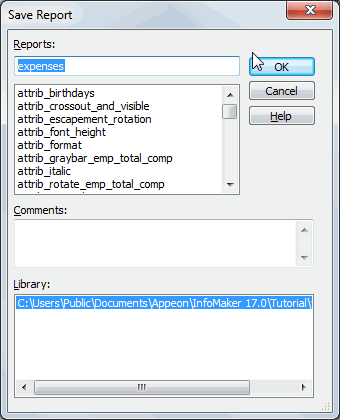
The Save Report dialog box displays; the name of the report you opened earlier is highlighted.
-
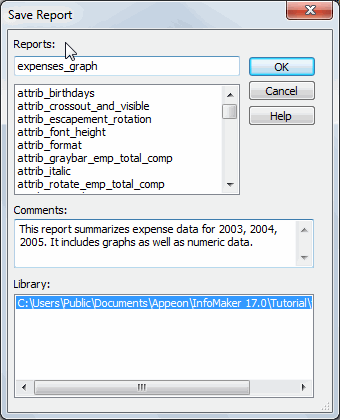
Type expenses_graph.
-
Click in the Comments box and type This report summarizes expense data for 2003, 2004, 2005. It includes graphs as well as numeric data.
-
Press Enter.
InfoMaker saves your report, including the graph.
