This section will talk about the following topics:
In order to make Appeon Performance Analyzer more convenient for future use, you can make some configurations in the System menu.
Click menu System | Config. The Appeon Performance Analyzer Configuration dialog opens:

Enable Tracing
This option controls if Appeon Performance Analyzer works or not. If you want to work with Appeon Performance Analyzer to analyze an application program, the option must be selected. By default it is selected.
Instant update
By selecting Instant update, the analysis data in the analyzing panel can be updated instantly when operation changes. When Instant update is not selected, Performance Analyzer will work faster; but users will need to manually click menu View | Update to see the latest data.
Restore to default location
By selecting this option, the main window of Appeon Performance Analyzer always opens at the default position. By unselecting this option, Appeon Performance Analyzer will remember its last position on the screen when it exits, and will open at the last location on the screen when it starts next time. By default, this option is selected.
Show window when started
By selecting this option, Appeon Performance Analyzer will automatically start when the Web application runs. You can deselect this option to disable the automatic starting of Appeon Performance Analyzer, and manually start Appeon Performance Analyzer by pressing Ctrl + Shift + F12. By default it is selected.
Child items limited
This option controls the maximum number of child items displayed in the treeview.
Enable log file
If you want to save the analyzing log in the local machine, select Enable log file. And the log file will be created after the Web application is closed.
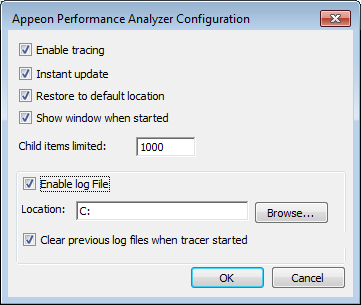
As shown above, the default destination is in C:\ disk. You can specify a different location by clicking Browse to select an existing folder on your computer.
Clear previous log files when tracer started
This option becomes selectable when Enable log file is selected. If you want to clear the analyzing log files saved in the last starting of Appeon Performance Analyzer, select this option.
After you finish the configuration, click OK to close the dialog.
Appeon Performance Analyzer enables you to perform the following analysis easily:
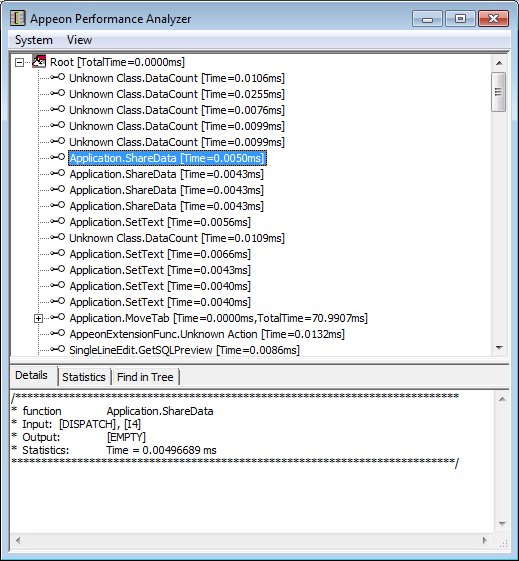
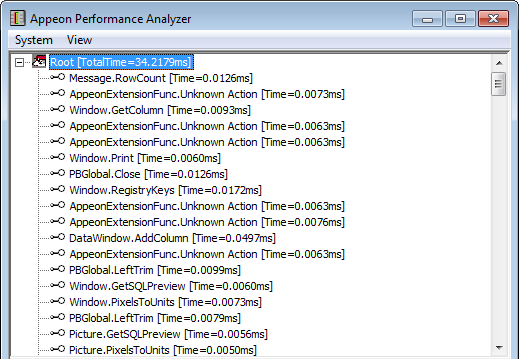
No matter what operation you execute on the Web application, e.g. a click on a button to open a dialog in the Web application, a root item Root will show in the first line of the analyzing panel to show the total executing time consumed by the operation.
By expanding Root, you can view the time consumed by different callings.
By default, the JS Calls, Ax Calls, RPC, Download, Detail View buttons are selected, which means, information related with them will be automatically displayed in the analyzing panel and the detail view panel.
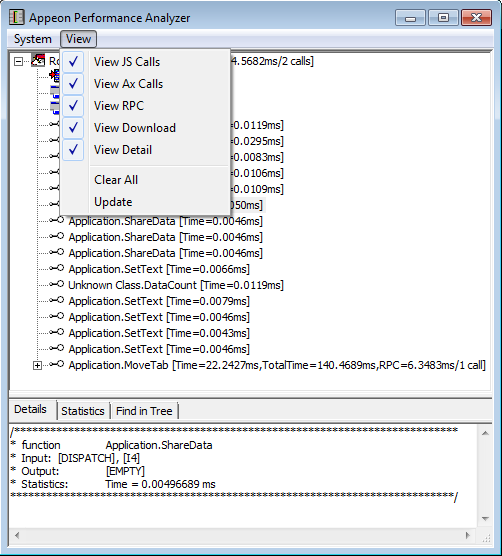
By default, the View | View JS Calls menu item is selected, so the JavaScript calls are automatically listed in the analyzing panel. If you do not want to view the JavaScript calls in the analyzing panel, you can click View JS Calls menu item to deselect it. If you want to view the JavaScript calls only, you can click the other menu items in the View menu to deselect them, as shown in the figure below.
You can expand the sub-nodes in the JavaScript calls list to further find out the time consumed by each JavaScript function calls.
You can see more details of JavaScript calls in the detail view panel.

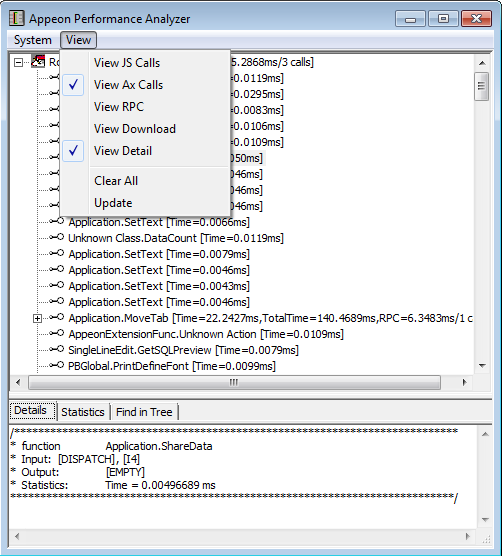
By default, View AX Calls menu item in the View menu is selected, so the ActiveX calls are automatically listed in the analyzing panel. If you do not want to view the ActiveX calls in the analyzing panel, you can click View AX Calls menu item to deselect it. If you want to view the ActiveX calls only, you can click the other optional menu items in the View menu to deselect them, as shown in the figure below.
You can see more details of the ActiveX calls in the Detail View panel.
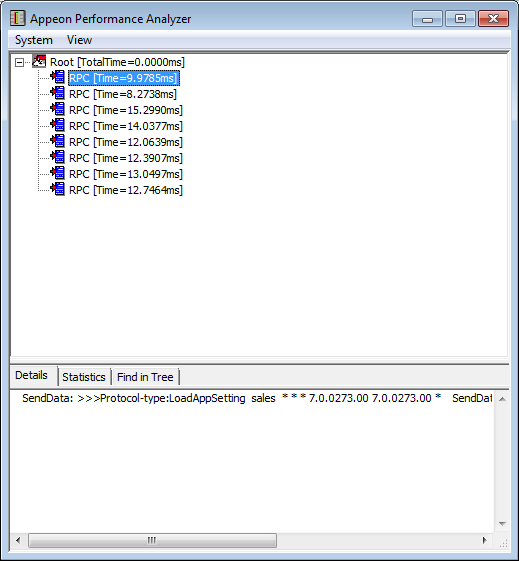
By default, View RPC in the View menu is selected, so the RPC calls are automatically listed in the analyzing panel. If you do not want to view the RPC calls in the analyzing panel, you can click View RPC menu item to deselect it. If you want to view the RPC calls only, you can click the other optional menu items in the View menu to deselect them, as shown in the figure below.
You can see more details of the RPC calls in the Detail View panel.

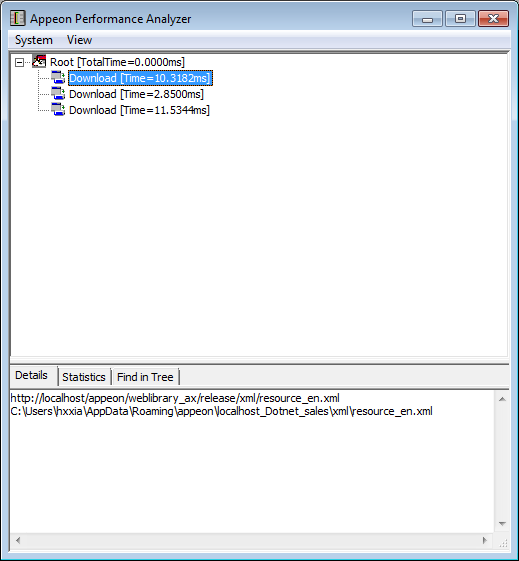
By default, View Download in the View menu is selected, so the downloads are automatically listed in the analyzing panel. If you do not want to view the downloads in the analyzing panel, you can click the View Download menu item to deselect it. If you want to view the downloads only, you can click the other optional menu items in the View menu to deselect them, as shown in the figure below.
You can see more details of downloads in the Detail View panel.

By default, the View | View Detail menu item is selected, so the detail view panel is automatically displayed beneath the analyzing panel. If you do not want to see the detail view panel, you can click the View Detail menu item to deselect it.
The detail view panel enables you to view the details and statistics of calls.
View details of JavaScript calls in the detail view panel:
Display the detail view panel by selecting the View Detail menu item in the View menu.
Select the View JS Calls menu item in the View menu to display the JavaScript calls in the analyzing panel, then select a JavaScript call, the statistics of the selected call are displayed in the Statistics tab of the detail view panel.

View details of ActiveX calls in the detail view panel by selecting the Details tab:
View statistics of ActiveX calls in the detail view panel by selecting the Statistics tab:

View details of RPC calls in the detail view panel by selecting the Details tab:
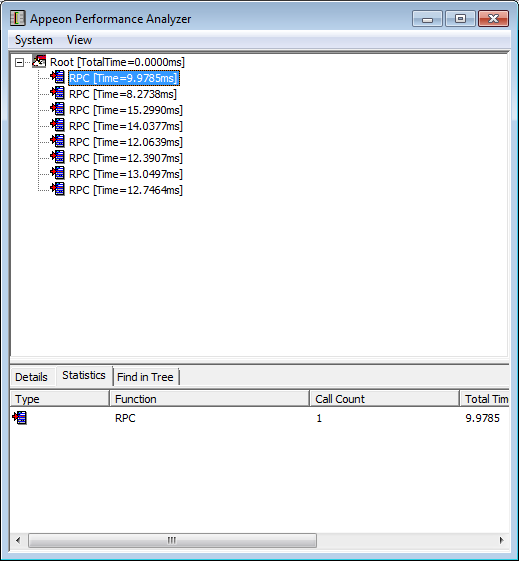
View statistics of RPC calls in the detail view panel by selecting the Statistics tab:
View details of downloads in the detail view panel by selecting the Details tab:
The Details tab shows the download URL on the Web server and the storage location of the downloaded file.
View statistics of downloads in the detail view panel by selecting the Statistics tab:

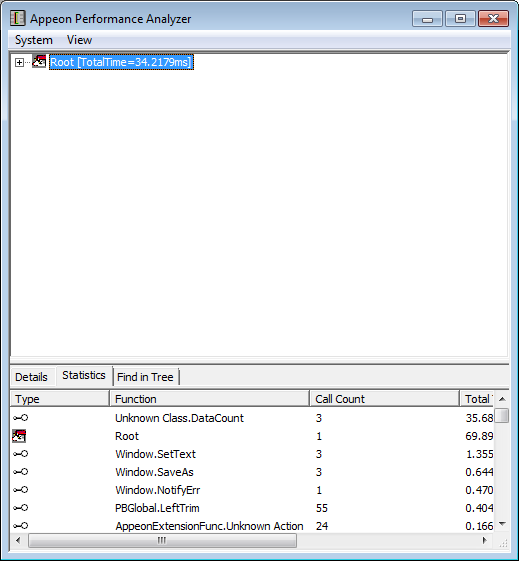
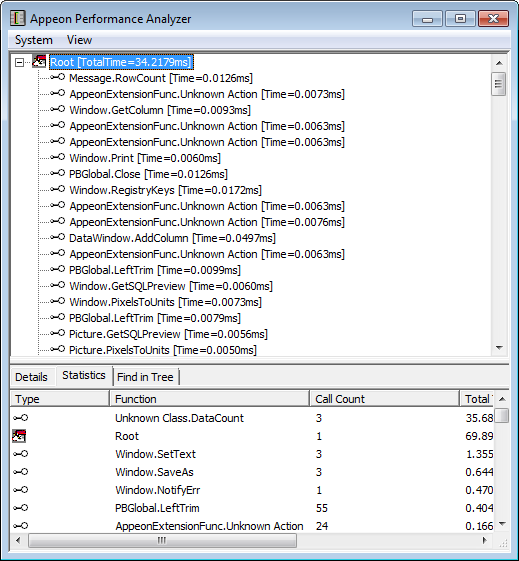
View statistics of root items in the detail view panel:
When you click the item of Root, the Statistics tab shows the statistics for all the calls.
Apart from the above, the detail view panel can also show the search results. Refer to the Find function for details.
Appeon Performance Analyzer also provides the following additional functions:
Appeon Performance Analyzer enables you to filter the functions or objects which you do not want to focus on temporarily. Here, in Appeon Performance Analyzer, to filter means to remove.
The filter function is only applicable to ActiveX calling analysis.
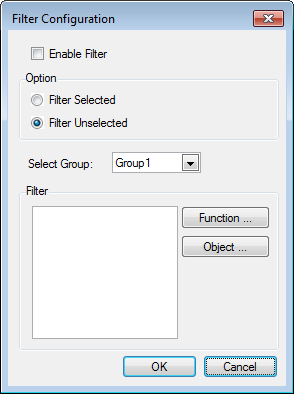
Click System | Filter menu item and the Filter Configuration dialog opens. Select Enable Filter.
Note: To enable the Filter function, you must make sure Enable Tracing is selected in System Configuration dialog.
If you want to analyze all the functions or objects in the application, make sure that Enable Filter is not selected.
Filter function for ActiveX calls analysis
Go through the steps below to learn how to filter objects and functions for ActiveX calls analysis.
Step 1: Make sure View AX Calls under the View menu is selected, so all the ActiveX functions and objects called in the operation are listed.
Step 2: Click menu System | Filter. In the Filter Configuration dialog, select Enable Filter.

Step 3: In the Filter group box, click the Function button. The Function Picker dialog opens.

Step 4: Select the functions and/or objects in the Unselected list. Click the arrow button
( ) to move the selected items to the Selected list. Click OK to close the dialog.
The double-arrow buttons  and
and  are used to move all items from one list to the
other.
are used to move all items from one list to the
other.
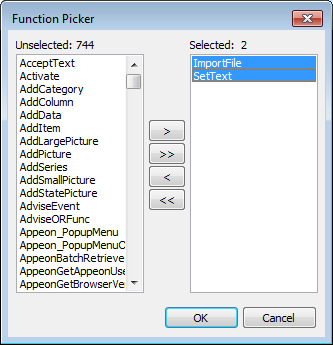
Now, the selected items are displayed in the Filter group box.
Note that they are in Group 1. You can have different groups for storing different selected items. The different groups can be all functions, all objects, or mixed with functions and objects.

Step 5: In the Option group box, select Filter Unselected. This will display the selected items only, and hide the unselected items. If you select Filter Selected, it will hide the selected items, and display the unselected items.
Step 6: Click OK to close the dialog.
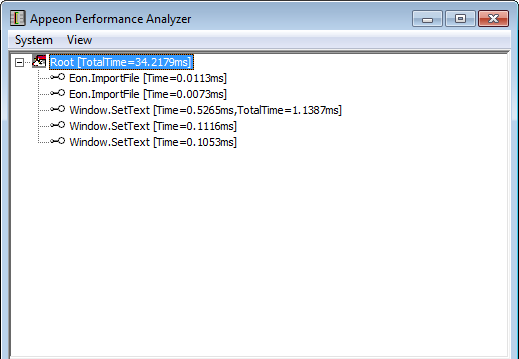
If Filter Unselected is selected, the analyzing panel is refreshed to show the selected items only (and hide the unselected items).
If Filter Selected is selected, the analyzing panel is refreshed to show the unselected items only (and hind the selected items).
You can find functions or objects by typing part of or complete name of the function or object.
If you click menu System | Find, a dialog box will pop up as below:

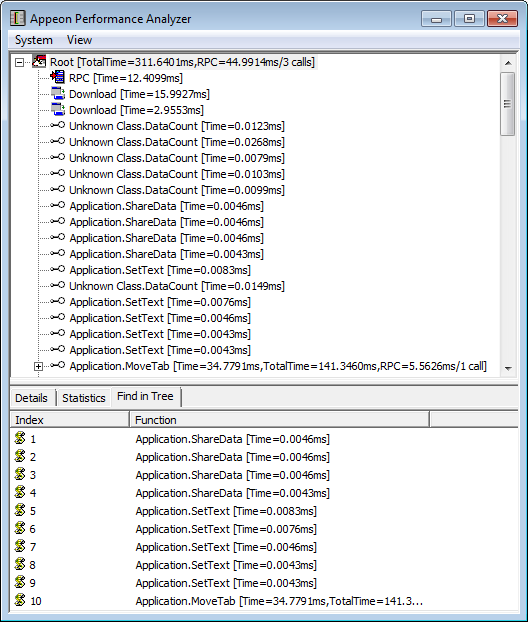
For example, type "applica" in the Find field, then click OK.

The detail View panel shows all the results related to "applica" in the Find in Tree tab.
The Performance Analyzer allows you to save the analysis contents in the analyzing panel as XML files.
If you click menu System | Save As XML, a dialog box will pop up as below:
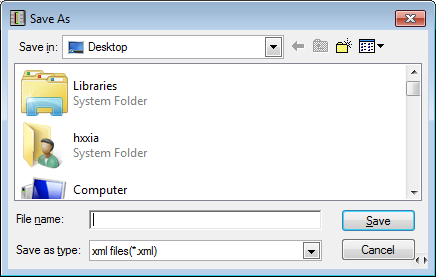
Input the file name and select the path, and then click the Save button to save the XML file.
To obverse analysis data easily, you can click menu View | Clear All to clear the original analysis data, or create new root items.
If you click menu System | New Root Item, a dialog box will pop up as below:

Input a root item name (eg. new) and click the OK button. A new root item named "new" is added in the analysis panel.
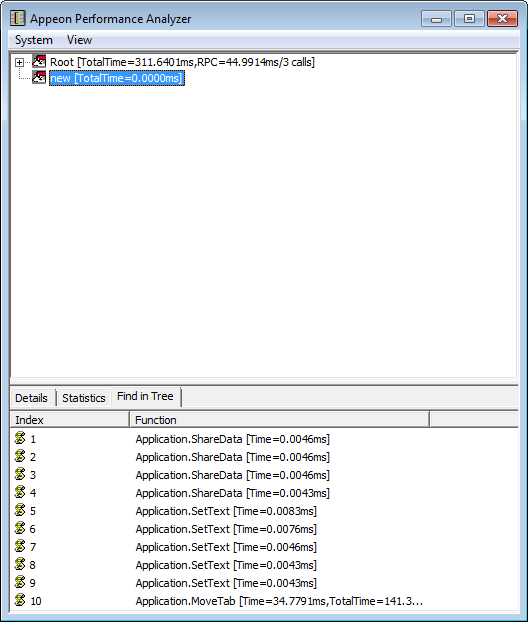
After this, the root item "new" will be used to display the analysis data in a way similar to the default Root item.

