Tour of SnapDevelop IDE
Unit Testing
SnapDevelop uses xUnit to run unit tests of the ASP.NET core apps. Unit testing ensures that the individual part (also known as the "unit") of an application meets it design and behaves as intended. Running unit tests frequently can help to keep code health, and find errors before the release of an application.
Create Unit Tests in SnapDevelop
This section describes how to create a unit test project.
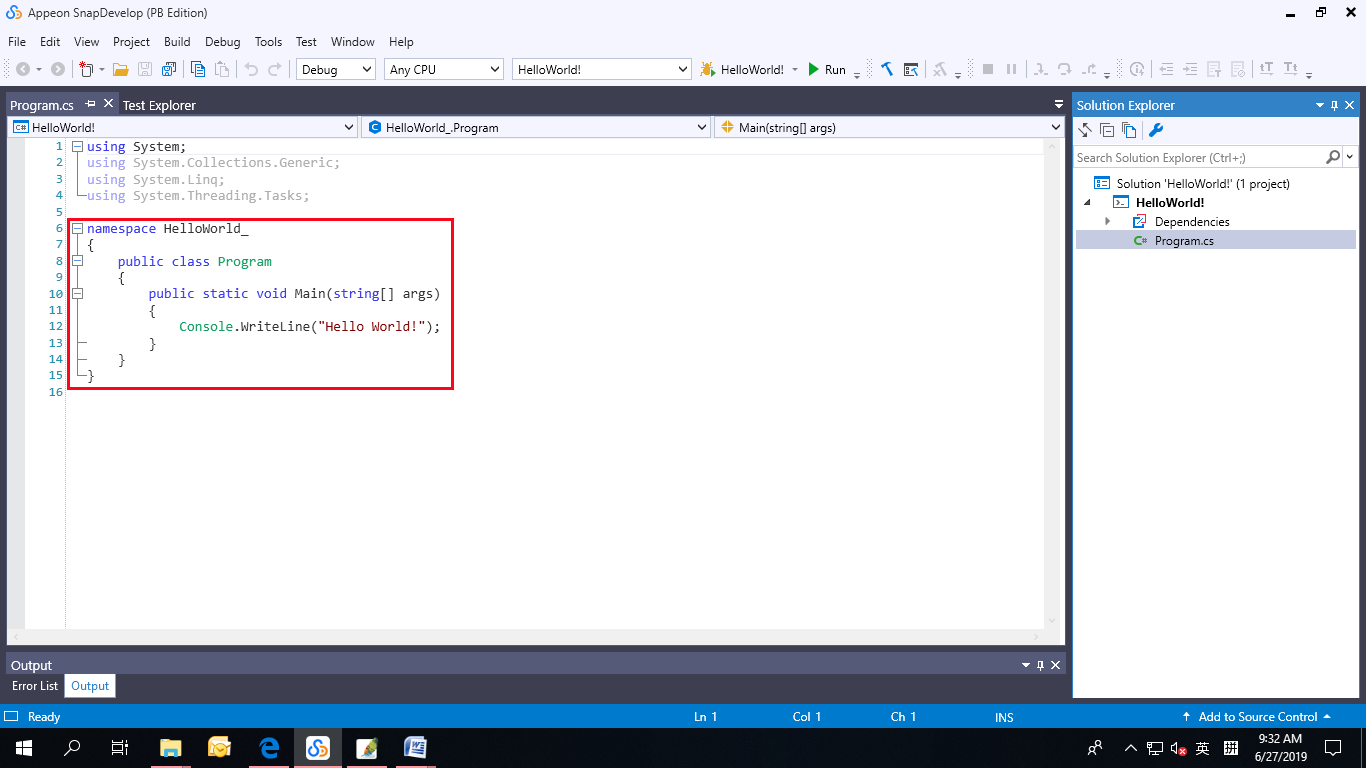
Open the project you want to test in SnapDevelop.
For the purpose of demonstratration, this tutorial tests a simple "Hello World" project.
In Solution Explorer, select the solution node. Then, right-click the selected node and choose Add > New Project.
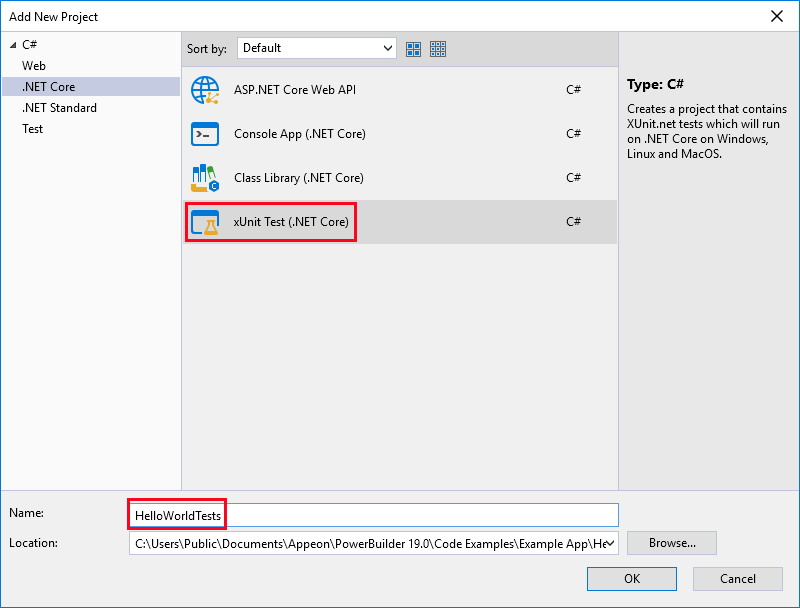
In the Add New Project dialog box, select the xUnit Test (.NET Core) as the test framework. Give a name for the test project, and then click OK.
The test project is added to your solution.
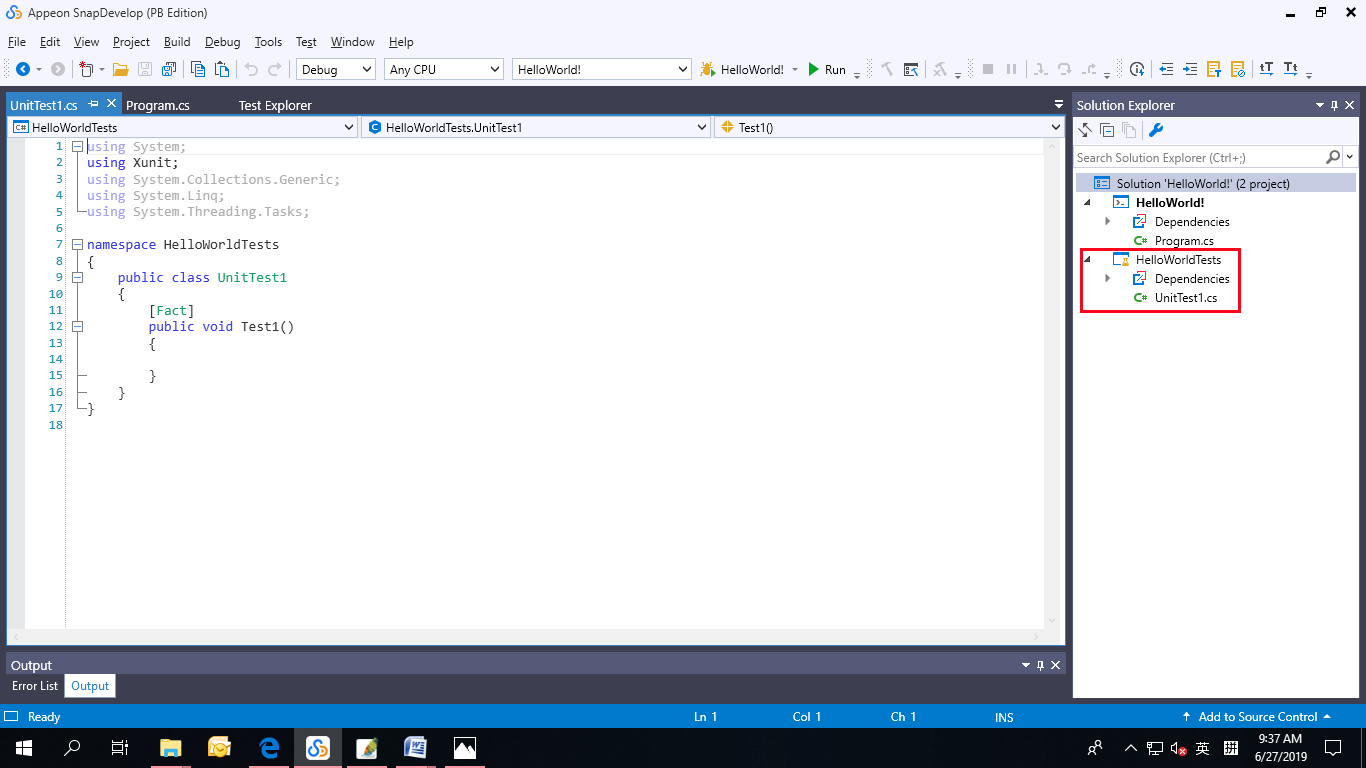
In the unit test project, add a reference to the project you want to test by right-clicking on Dependencies and then choosing Add Reference.
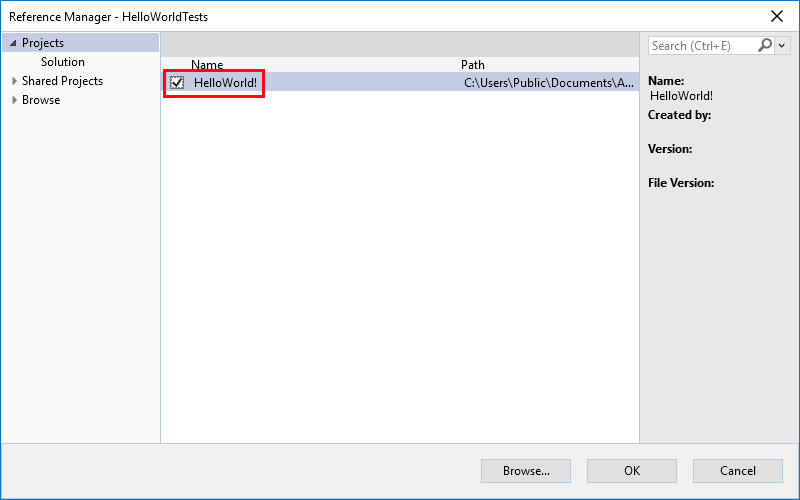
Select the project that contains the code you'll test and click OK.
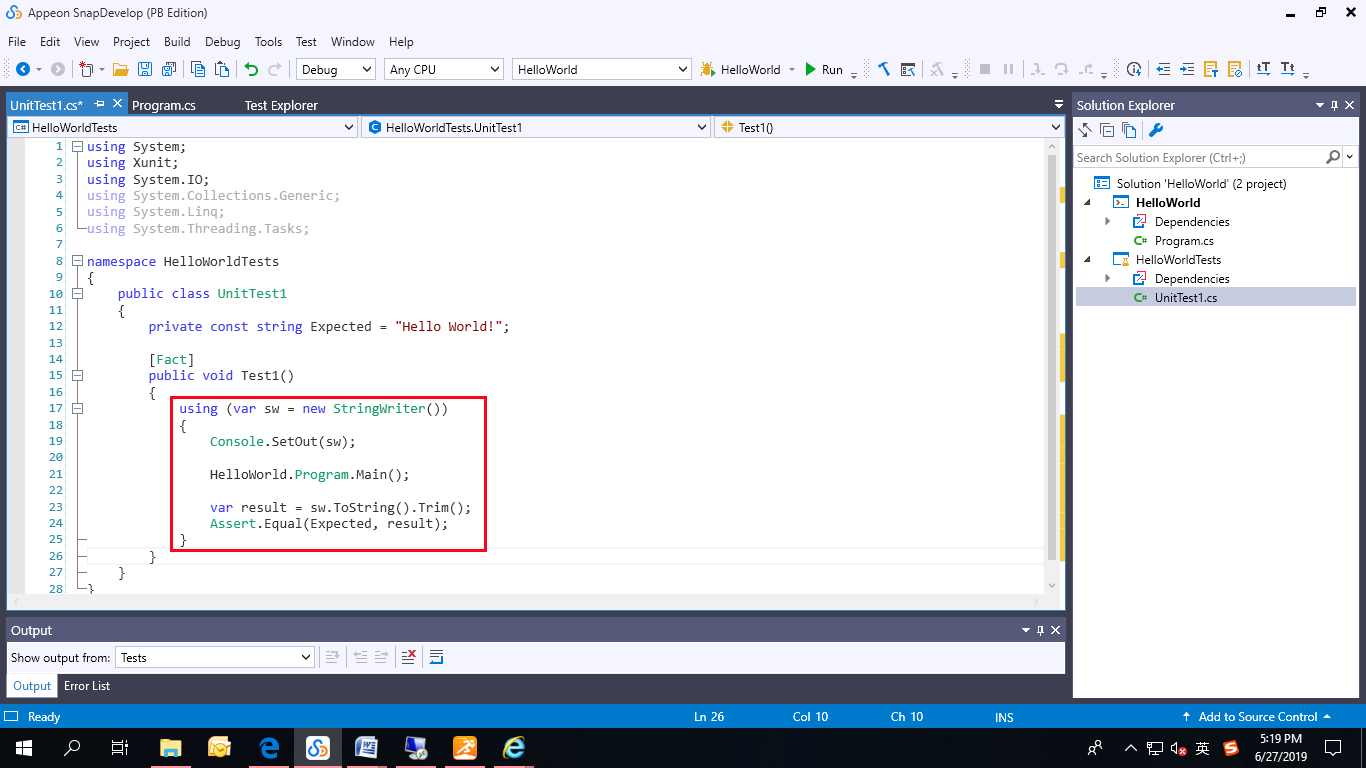
Add code to the unit test method.
You can add several unit test methods to test the different parts of your project; you can also add several test methods to test one single part from different perspectives.
Run Unit Tests in Test Explorer
Unit tests can be run from the Test Explorer.
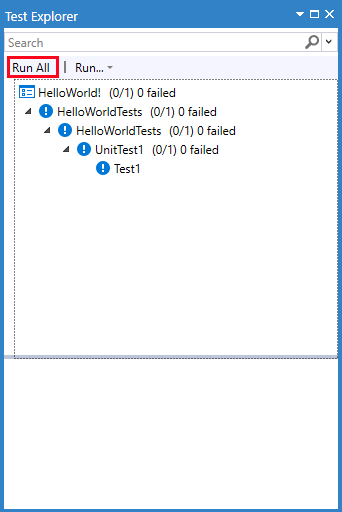
Open Test Explorer by choosing Test > Test Explorer from the top menu bar.
Run all unit tests by clicking Run All, or run the selected tests by choosing Test > Run Selected Tests from the top menu bar (you can also select the tests you want to run, right-click the tests and then choose Run Selected Tests).
You can also choose to run Failed/Not Run/Passed tests via Test from the top menu bar.
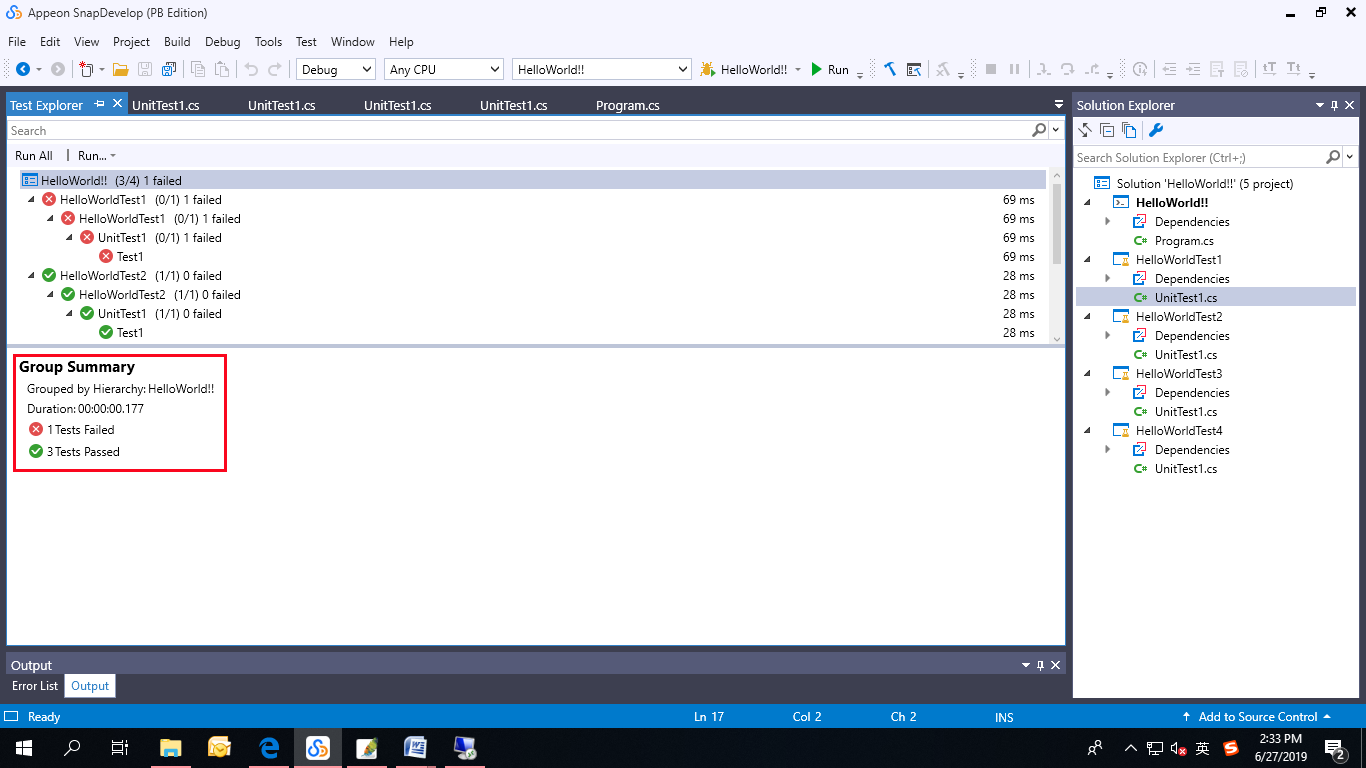
The pass/fail bar at the top of the Test Explorer window is animated as the tests run. After the tests have completed, the pass/fail bar turns green if all tests passed or turns red if any test failed.
View Test Results
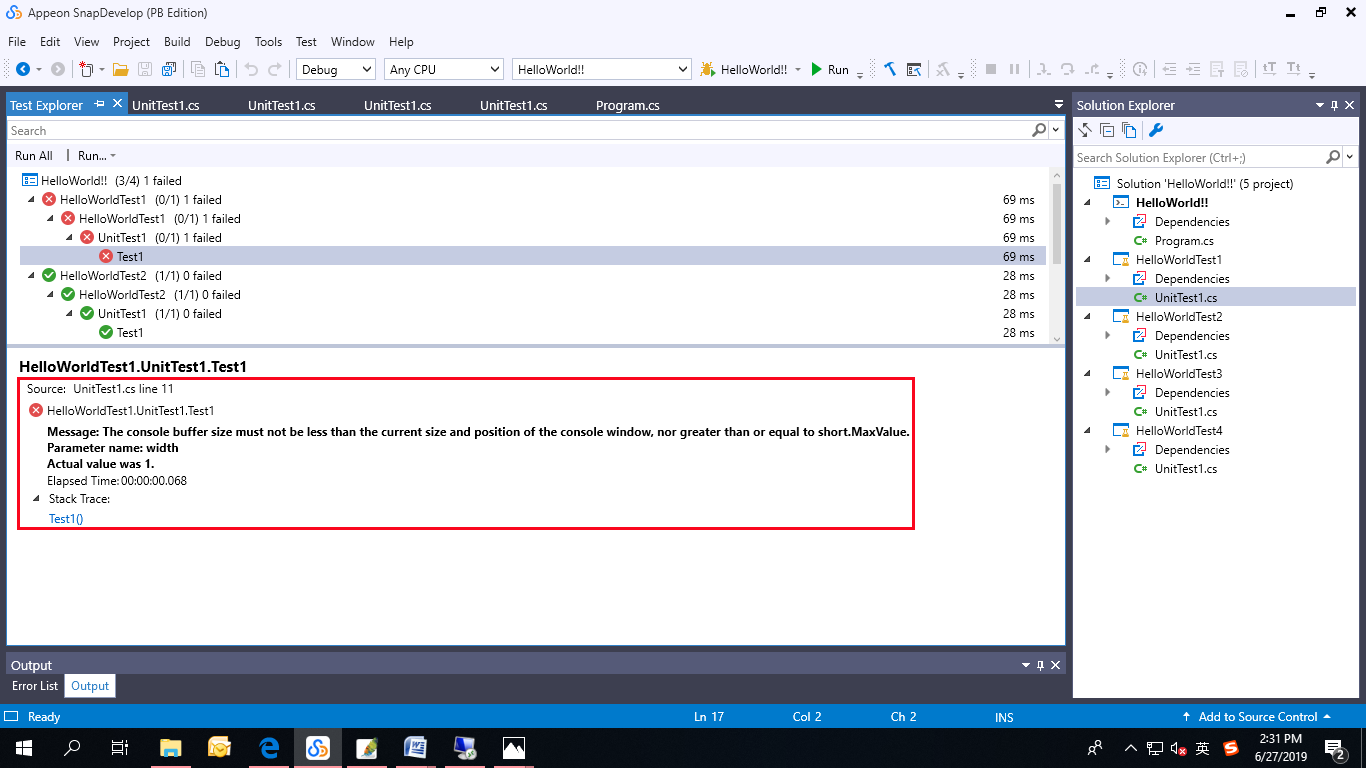
As the tests run, Test Explorer displays the results. The details pane at the bottom of Test Explorer displays a summary of the test run.
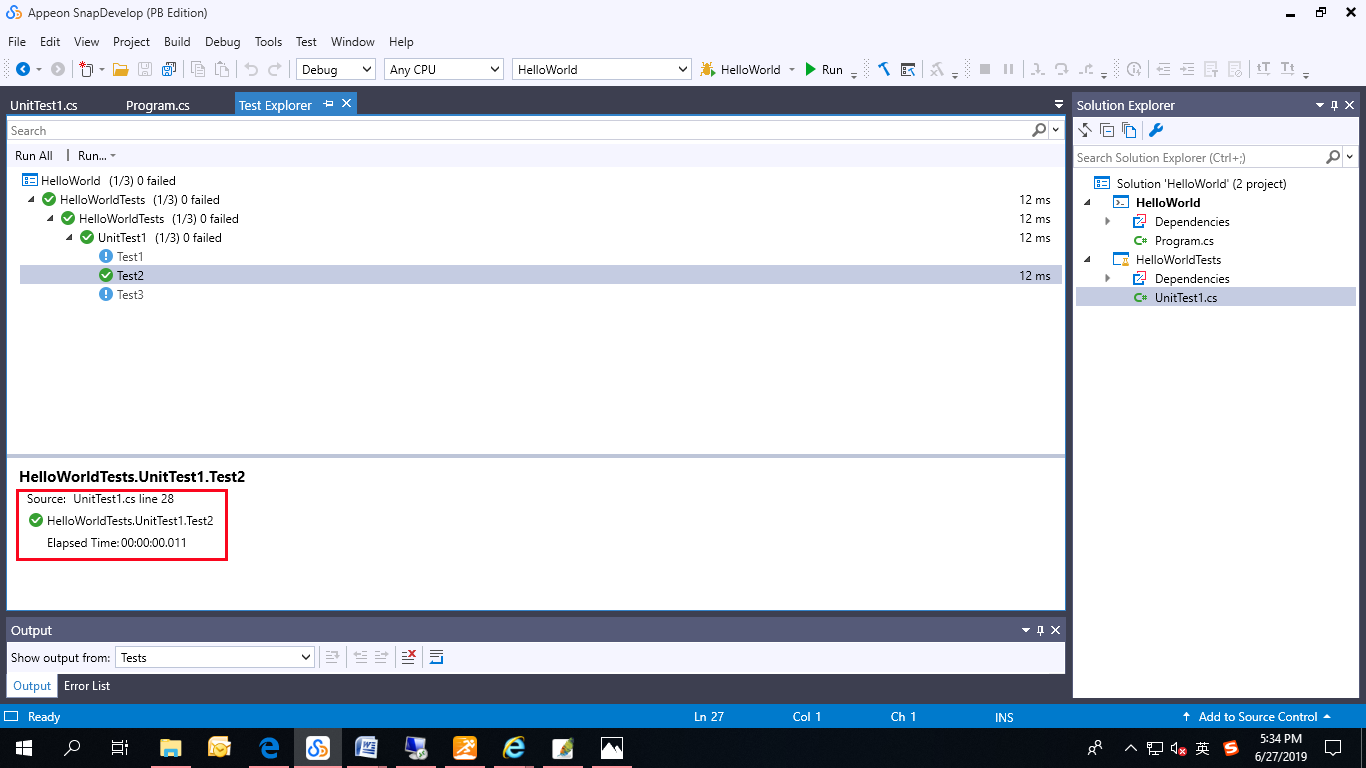
You can select a specific test to view the details of the test. The test details pane displays the following information:
The source file name and the line number of the test method.
The status of the test.
The elapsed time that the test method took to run.
If the test fails, the details pane displays the following information:
The message returned by the unit test framework for the test.
The stack trace at the time the test failed.
Debugging
Debugging is used to track the running process of code and resolve the defect or problem within an app. A debugger can be used to effectively and accurately locate an exception.
SnapDevelop uses Mono debugger to debug the C# code. Mono debugger is a cooperative debugger that is built into the Mono runtime. It offers a number of ways to see what your code is doing while it runs. For example, you can set breakpoints; you can step through your code and examine the values stored in variables; you can set watches on variables to see when values change; you can inspect the call stack to understand the execution flow of an app.
This tutorial presents a brief introduction to the basic features of the SnapDevelop debugger in a step-by-step manner. In this tutorial, you will learn to:
- Set a breakpoint
- Step through code in the debugger
- Check variables via data tips and Locals window
- Add a watch on a variable
- Inspect the call stack
Create a Project
This section creates a simple C# project for demonstrating the key features of the SnapDevelop debugger.
Open SnapDevelop 2019.
From the top menu bar, choose File > New > Project. In the left pane of the New Project dialog box, under C#, choose .NET Core, and then in the middle pane choose Console App (.NET Core). Then, give a name for the project and click OK.
SnapDevelop creates the project.
In Program.cs, replace the current code
using System;
using System.Collections.Generic;
using System.Linq;
using System.Threading.Tasks;

namespace Debugging
{
    class Program
 {
        static void Main(string[] args)
        {
            Console.WriteLine("Hello World!");
        }
    }
}
with the following code:
using System;
using System.Collections.Generic;

public class Animal
{
    public int Appetite { get; set; }
    public int Weight { get; set; }

    public virtual void Feed()
    {
        Console.WriteLine("Performing base class feeding tasks");
    }
}

class Dog : Animal
{
    public override void Feed()
    {
        Console.WriteLine("Feeding a dog");
        base.Feed();
    }
}

class Cat : Animal
{
    public override void Feed()
    {
        Console.WriteLine("Feeding a cat");
        base.Feed();
    }
}

class Pig : Animal
{
    public override void Feed()
    {
        Console.WriteLine("Feeding a pig");
        base.Feed();
    }
}

class Program
{
    static void Main(string[] args)
    {

        var animals = new List<Animal>
        {
            new Dog(),
            new Cat(),
            new Pig()
        };

        foreach (var animal in animals)
        {
            animal.Feed();
        }
        Console.WriteLine("Press any key to exit.");
        Console.ReadKey();
    }
}
In the following sections, we'll use this app to demonstrate the key features of the SnapDevelop debugger.
Launch the Debugger
Press F5 (or select Debug > Start Debugging) or the Debugging button (
 ) on the toolbar.
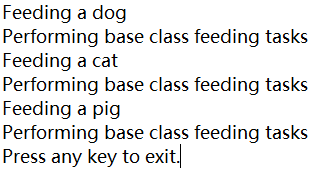
F5 starts the app with the debugger attached to the app process. Since nothing was done to debug the code, the app just loads and generates the following console output.
Stop the debugger by pressing the red stop (
 ) button.
Set a Breakpoint
Breakpoints are the most basic feature of the SnapDevelop debugger. A breakpoint indicates where the debugger should suspend your running code so that you can look at the values of variables, or whether or not a block of code is executed. It is very useful if you want to examine a block of code or a line of code in detail.
In the
foreachloop of theMainmethod, set a breakpoint by clickinganimal.Feed()and then pressing F9 (or right-clickinganimal.Feed()and then select Breakpoint > Insert Breakpoint):A red circle appears in the left margin of the line of code you clicked.

If you want to delete or disable the breakpoint, you just hover over the breakpoint, right-click your mouse and make the choice accordingly.
Click the Debugging button (
) or press F5. The app launches, and the debugger runs to the line of code where you set the breakpoint.The app execution is suspended and a yellow arrow appears in the left margin of the line of code where the debugger paused (this line of code has not yet been executed).

Pressing F5 to continue running the app or running to the next breakpoints (if any).
Step Through Code
Usually we use the step commands (Step Into, Step Over, and Step Out) and the Run to Cursor command to step through code in the debugger.
Step Into
To step through one line of code at a time (including each line of code in the method that is called by the current method), choose Step Into from the Debug menu (or press F11).
For example, when the debugger pauses at the animal.Feed method, you can step into the method to execute each line of code in the animal.Feed method and then the code in the Feed() method that is called by the animal.Feed method (and then the code in the base.Feed method that is called by the Feed() method).
Step Over
To step through one line of code at a time (but do not step through each line of code in the method that is called by the current method), choose Step Over from the Debug menu (or press F10).
For example, when the debugger pauses at the animal.Feed method, you can step over so that the debugger only steps through each line of code in the animal.Feed method, but does not step through each line of code in the Feed() method that is called by the animal.Feed method (and then the base.Feed method that is called by the Feed() method). Although the debugger does not step into each line of code of the Feed method and the base.Feed method, these lines of code are still executed.
Step Out
To return to the line of code that calls the current method, choose Step Out from the Debug menu (or press Shift + F11).
For example, when you stepped into the base.Feed method, if you press Shift + F11, you will step out from the base.Feed method and return to the Feed method, and if you press Shift + F11 once again, you will step out from the Feed method and return to the animal.Feed method.
Run to Cursor
While the program is in debug mode, right-click a line of code in your app and select Run to Cursor; this command sets a temporary breakpoint at the current line of code. If breakpoints have already been set, the debugger pauses at the first breakpoint that it hits. You can use this command when you need to quickly set a temporary breakpoint.
Check Variables with Data Tips or Locals Window
Variables can be checked via data tips and Locals window.
Check Variables with Data Tips
Usually, when you are debugging an issue, you try to figure out whether variables are storing the desired values. The data tips are a good way to do it.
When the debugger pauses on the
animal.Feed()method, you can hover over theanimalobject and you will see its default property value, which isDog.Expand the
animalobject to see its properties, such as theWeightproperty, which has a value of 0.
Press F10 (or select Debug > Step Over) several times to iterate once through the
foreachloop until the debugger pauses again on theanimal.Feed()method.Hover over the
animalobject again, and this time you have a new object typeCat.
Check Variables with the Locals Window
The Locals window displays the variables that are in the current execution context.
When the debugger pauses in the
foreachloop, click the Locals window, which is by default open in the lower left pane of the code editor.If it is closed, open it by selecting Debug > Windows > Locals from the menu bar.
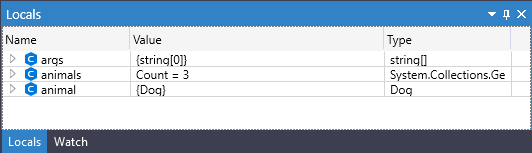
Press F11 to advance the debugger so that you can check the variables in the execution contexts.
Add a Watch
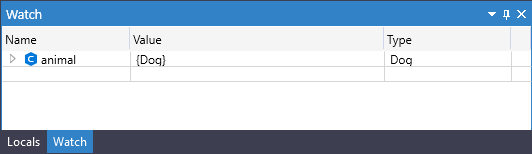
In the code editor window, right-click the animal object and select Add Watch.
The Watch window opens at the bottom left corner of the code editor. You can use the Watch window to specify an expression or a variable you want to monitor.
After you have set a watch on the animal object, you can see its value change as you run through the debugger. Unlike the other variable windows, the Watch window always displays the variables you are monitoring. They are grayed out when out of scope or an error is reported.
Inspect the Call Stack
The Call Stack window displays the order in which functions or methods are called. It can be used to examine and understand the execution flow of a program.
When the debugger pauses in the
foreachloop, click the Call Stack window, which is by default open in the lower right pane.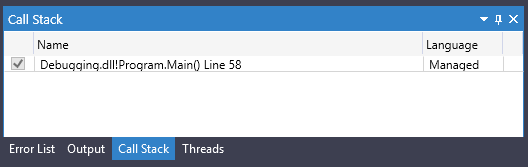
If it is closed, open it by selecting Debug > Windows > Call Stack from the menu bar.
Click F11 several times until you see the debugger pauses in the
base.Feedmethod for theDogclass in the code editor. Look at the Call Stack window.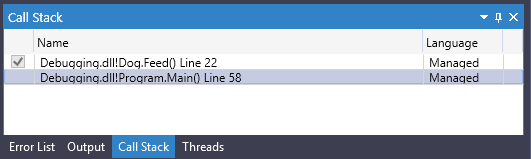
The first line displays the current function (the
Dog.Feedmethod in this app). The second line shows thatDog.Feedis called from theMainmethod.